


Solana traded near $127.33 on the SOLUSD 4 hour Coinbase chart created on Jan. 2, 2026. Price stayed above a rising support line that started after the sharp drop around Dec. 19.
However, the candles kept clustering in a tight band, so the move still reads as consolidation instead of a clean trend leg.
Stay ahead in the crypto world – follow us on X for the latest updates, insights, and trends!🚀
At the same snapshot, the 50 period EMA sat near $124.89, which kept price slightly above its short term average.
That placement supports the idea of an upward bias in the latest swing.
Even so, the chart also shows repeated pullbacks and overlapping candles, which usually signals hesitation rather than follow through.
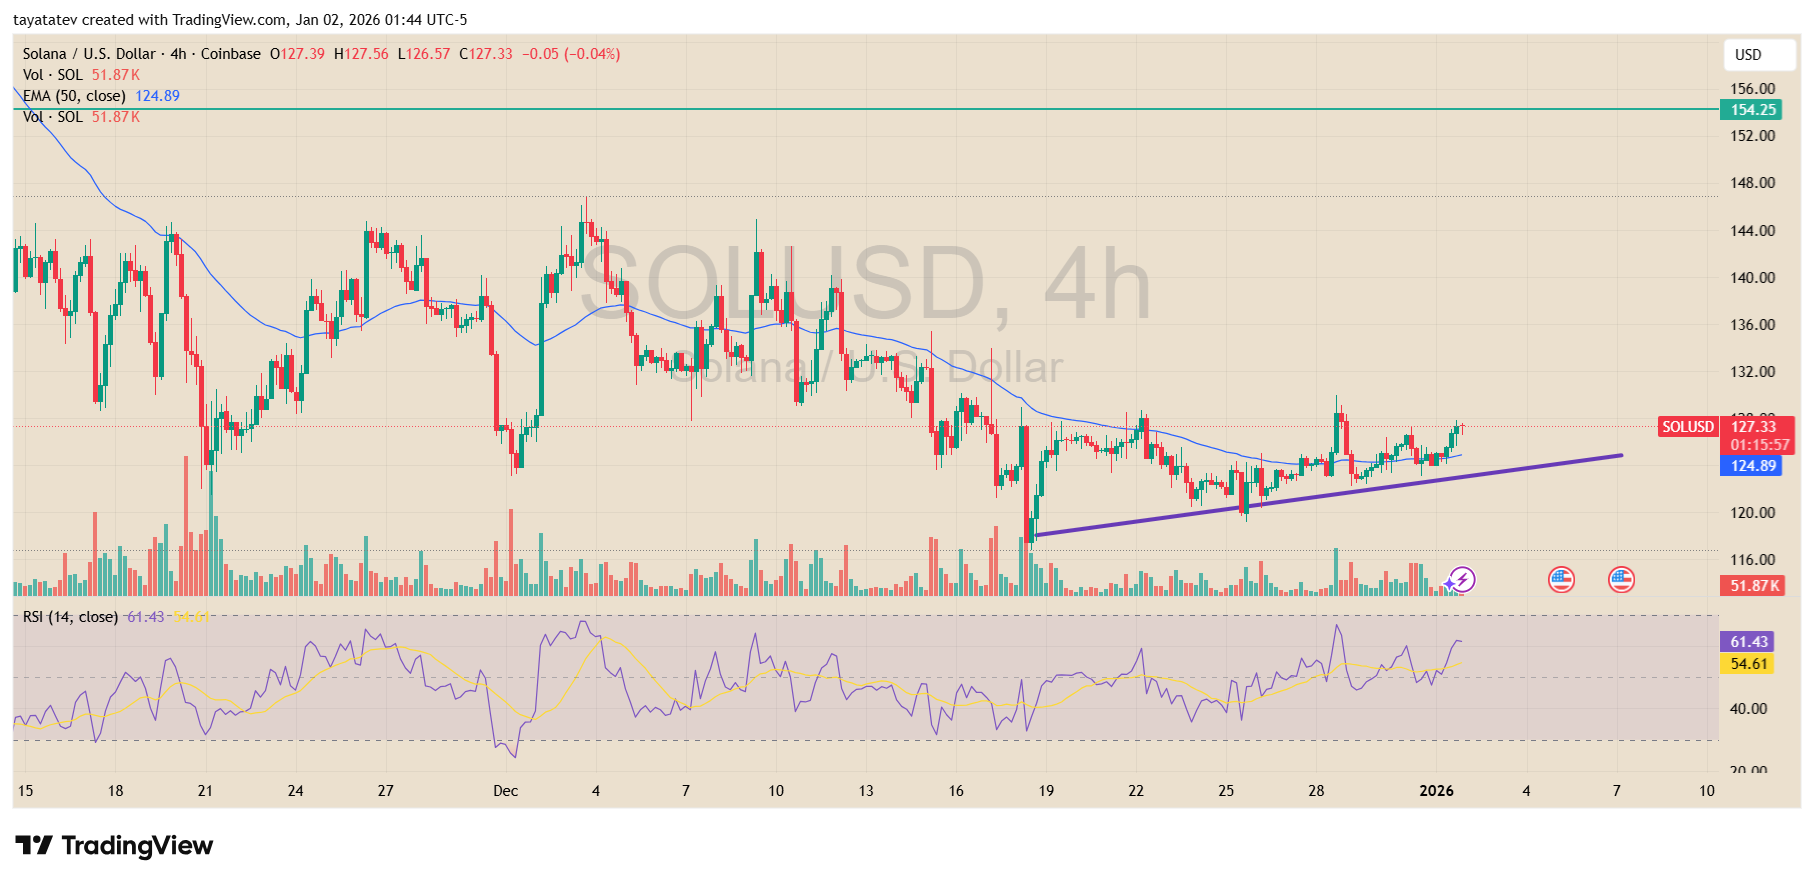
The next visible decision area sits around $129 to $130, where recent highs have stalled.
A sustained push above that zone would mark a clearer break from the current range and would help confirm a reversal from the late December base. Until that happens, the structure remains a slow grind higher with no decisive expansion.
Momentum looked firmer but not explosive. The RSI (14) printed about 61.43, which sits in a stronger zone than neutral readings.
Still, the indicator has moved up and down through the same band for weeks, so it matches the chart’s broader message: upward pressure exists, yet the market still waits for a clean breakout signal.
Solana tests long downtrend on the 8 hour chart, but structure still looks compressed
Solana traded near $127.38 on the SOLUSDT 8 hour Binance chart created on Jan. 2, 2026.
Price moved back toward a long descending trendline that has capped rallies since October.
Although candles pushed higher from late December lows, the market has not yet produced a clear breakout.
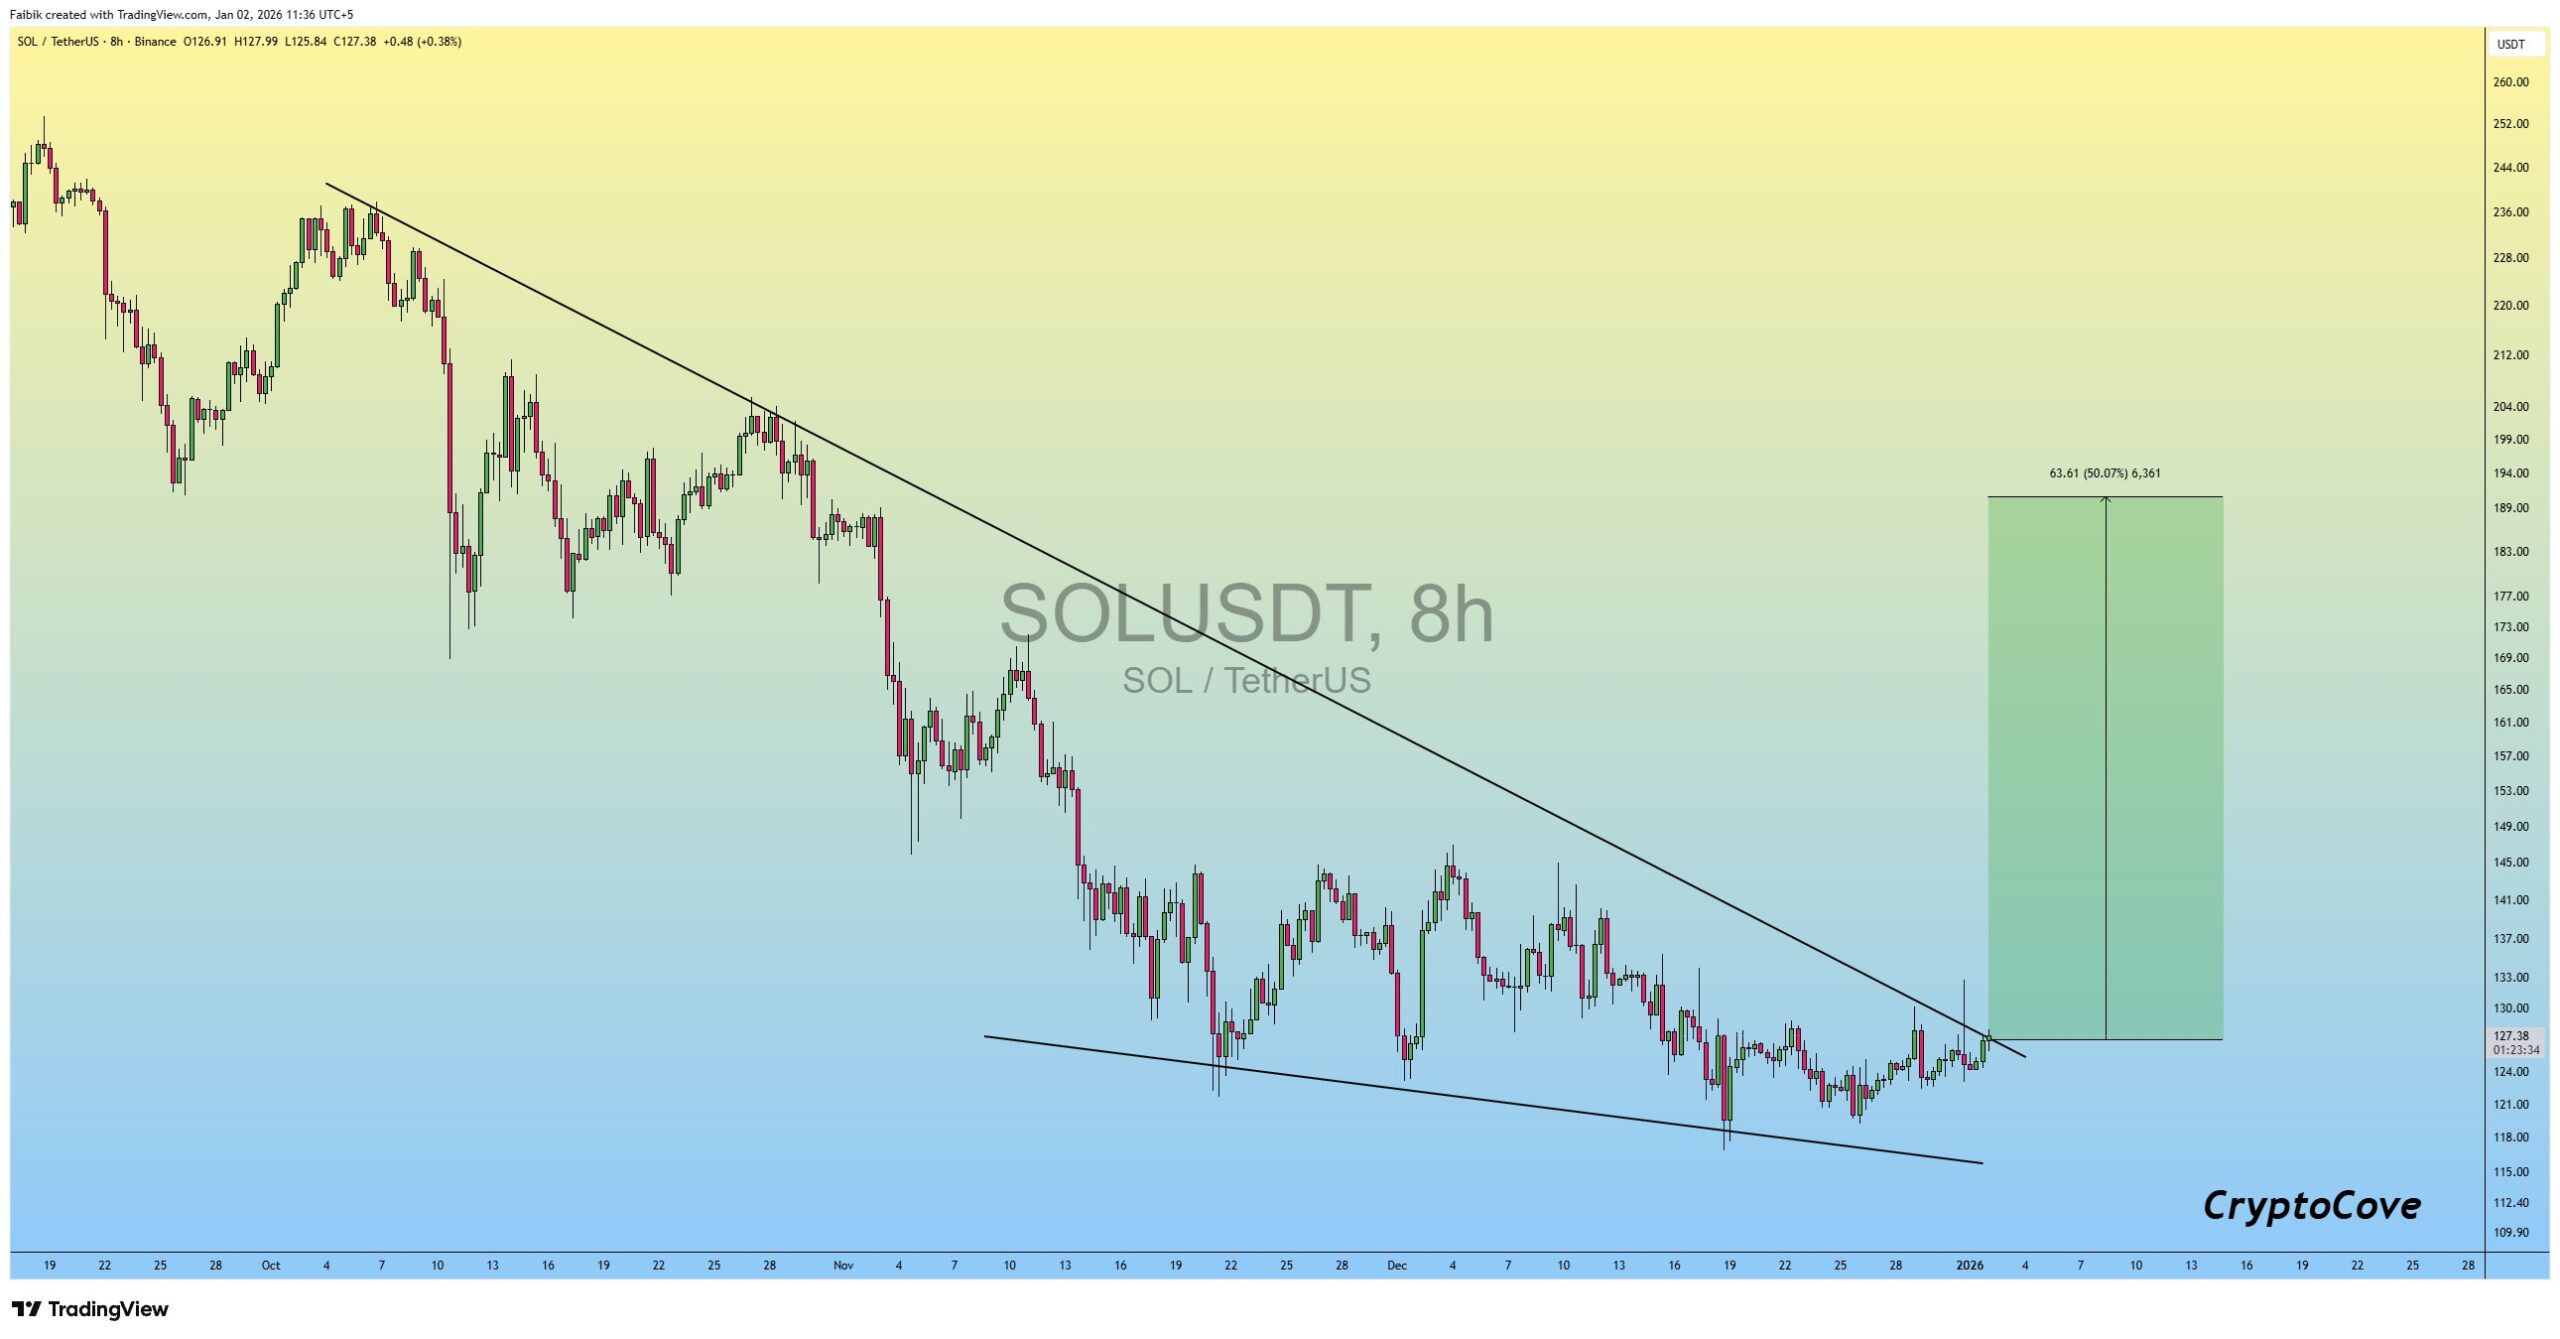
The broader structure still reflects a prolonged downtrend. Lower highs remain visible across the chart, while price continues to respect the descending resistance line.
At the same time, Solana has held above a gently rising lower boundary since mid December.
That combination keeps price trapped between converging trendlines, which signals consolidation rather than confirmation of a trend shift.
Recent candles show tighter ranges and overlapping bodies near the trendline test. This behavior often appears when buyers and sellers wait for confirmation.
While upside pressure has increased, the move lacks expansion in range, so the chart does not yet show decisive follow through.
A sustained break and hold above the descending trendline would be needed to confirm a structural change. Until then, the price action still reflects compression inside a broader bearish framework.
For now, the 8 hour chart suggests stabilization after a long decline, but the market has not clearly reversed.
Disclosure:This article does not contain investment advice or recommendations. Every investment and trading move involves risk, and readers should conduct their own research when making a decision.
Kriptoworld.com accepts no liability for any errors in the articles or for any financial loss resulting from incorrect information.

Tatevik Avetisyan is an editor at Kriptoworld who covers emerging crypto trends, blockchain innovation, and altcoin developments. She is passionate about breaking down complex stories for a global audience and making digital finance more accessible.
📅 Published: January 2, 2026 • 🕓 Last updated: January 2, 2026
