

 Price Analysis Rising Wedge Signals 23 Percent Drop as SOL Stays in 600 Day Range")
On Nov. 11, 2025, Solana’s 4-hour SOLUSD chart on Coinbase showed price trading near 165 dollars while testing the 50-period exponential moving average around 166 dollars.
The move came after a sharp early-November sell-off, followed by a weaker rebound that unfolded inside two converging, upward-sloping trendlines.
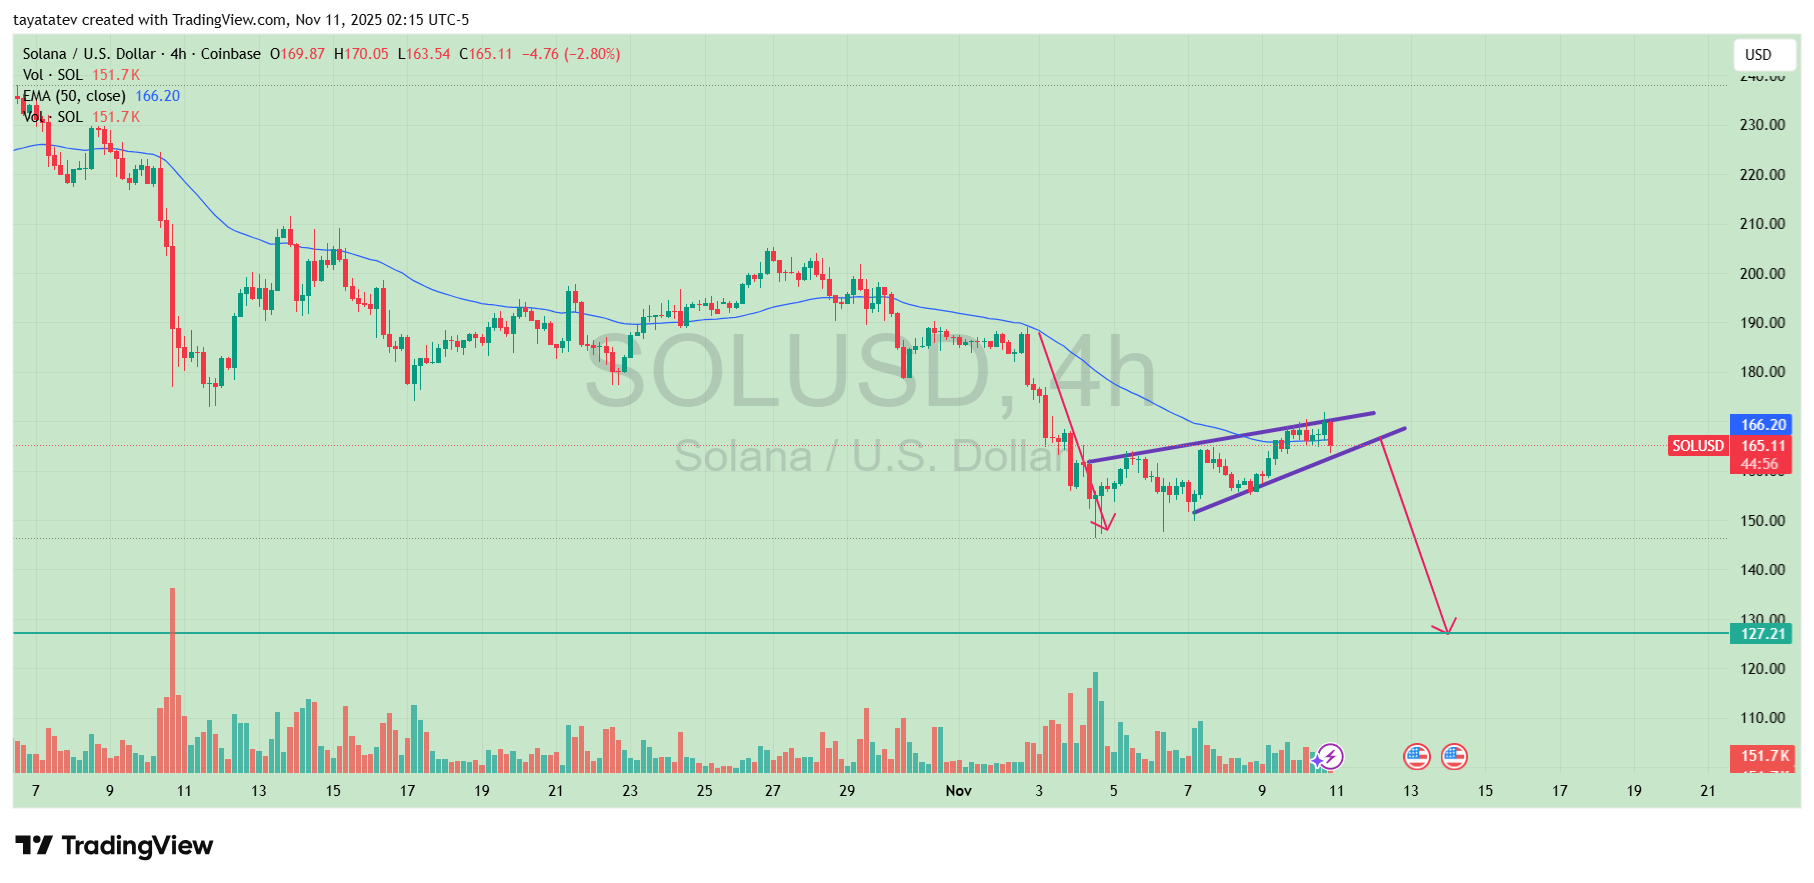
This structure created a rising wedge pattern. In simple terms, a rising wedge appears when both highs and lows move higher, yet the distance between them keeps shrinking.
Price climbs, but momentum fades and each new high shows less strength than the previous one.
In a downtrend, technicians usually treat this pattern as a bearish continuation signal once price breaks below the lower wedge line.
On the current chart, Solana trades near the upper boundary of the wedge and below the 50-period EMA, while volume stays lower than during the initial drop.
If the pattern confirms with a decisive breakdown under the lower trendline, the wedge points to a measured move of about 23 percent.
That would imply a potential decline from roughly 165 dollars to around 127 dollars, in line with the horizontal support level marked near 127.2 dollars on the chart.
Solana extends 600-day range as price retests mid-zone support
A chart shared by analyst Inmortal on Nov. 11 shows Solana (SOL) continuing to trade inside a horizontal range that has lasted roughly 600 days.
The structure stretches between two key levels—around 120 dollars on the lower boundary and 210 dollars on the upper boundary—with the token currently positioned near the middle of the channel.
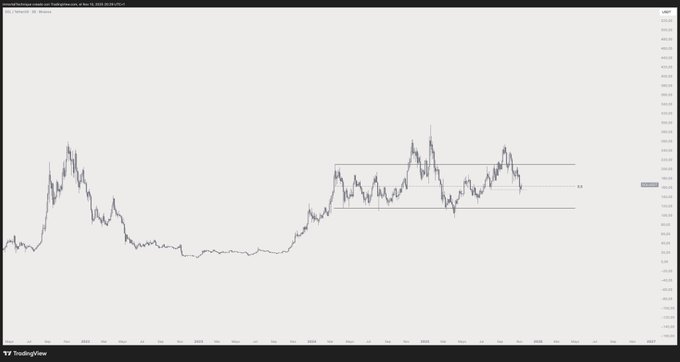
The long-term chart highlights how Solana has struggled to break the upper resistance zone since mid-2023, forming several peaks around the same level.
Each attempt to rally above 210 dollars has been followed by a sharp pullback toward the range midpoint.
This behavior indicates a lack of directional conviction as buyers and sellers continue to balance within a defined area.
Range trading of this length often suggests market indecision after a prolonged recovery phase. Price continues to oscillate between the two extremes, with traders focusing on the 120-dollar support as the key line to defend.
A sustained close below that floor could confirm a bearish breakdown, while a breakout above 210 dollars would signal renewed bullish momentum after nearly two years of consolidation.
Disclosure:This article does not contain investment advice or recommendations. Every investment and trading move involves risk, and readers should conduct their own research when making a decision.
Kriptoworld.com accepts no liability for any errors in the articles or for any financial loss resulting from incorrect information.

Tatevik Avetisyan is an editor at Kriptoworld who covers emerging crypto trends, blockchain innovation, and altcoin developments. She is passionate about breaking down complex stories for a global audience and making digital finance more accessible.
📅 Published: November 11, 2025 • 🕓 Last updated: November 11, 2025
