


The chart shared by ChartNerdTA shows XRP repeatedly losing long-term support levels after extended consolidation phases.
First, price trends higher along a rising support line, then breaks sharply below it. Each breakdown triggers a fast, vertical decline, highlighted by long red arrows on the chart.
Stay ahead in the crypto world – follow us on X for the latest updates, insights, and trends!🚀
This pattern appeared in the 2016–2017 period and again near the 2018 peak, followed by a deep multi-year drawdown.
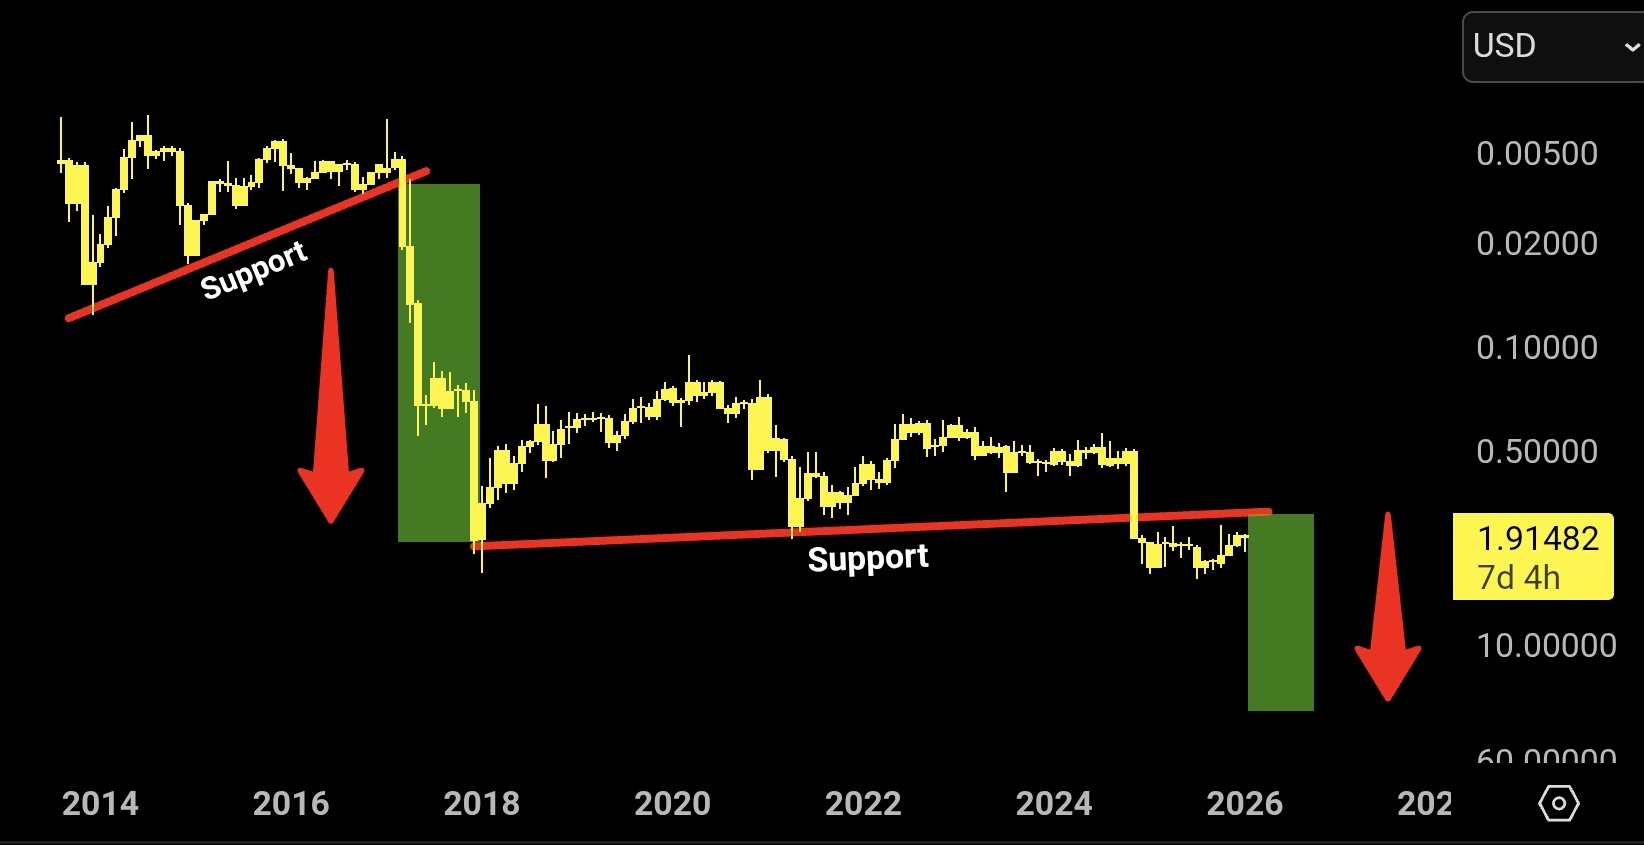
Later price action shows XRP stabilizing on a flatter support line, but that level also fails over time. After the breakdown, XRP trades sideways below former support, unable to reclaim it as resistance.
The chart marks this behavior again in the 2021–2024 range, where price compresses before slipping lower. The current structure mirrors earlier cycles, with price sitting just above a weakened support zone.
The green projected zones suggest the next move could follow the same historical path.
If support fails again, the chart implies another accelerated drop rather than a gradual decline.
Overall, the visual setup emphasizes trendline failure, loss of structural support, and repeated downside follow-through as the dominant features shaping XRP’s long-term price behavior.
XRP Liquidation Heatmap Shows Pressure Building Below Price
The 24 hour Binance XRP USDT liquidation heatmap highlights dense clusters of leveraged positions stacked both above and below current price.
The brightest bands, shown in green and yellow, concentrate around the $1.85–$1.90 zone and again near the $1.95–$2.00 range.
These areas signal where forced liquidations are most likely if price moves with momentum. As a result, they act as short-term magnets during volatility spikes.
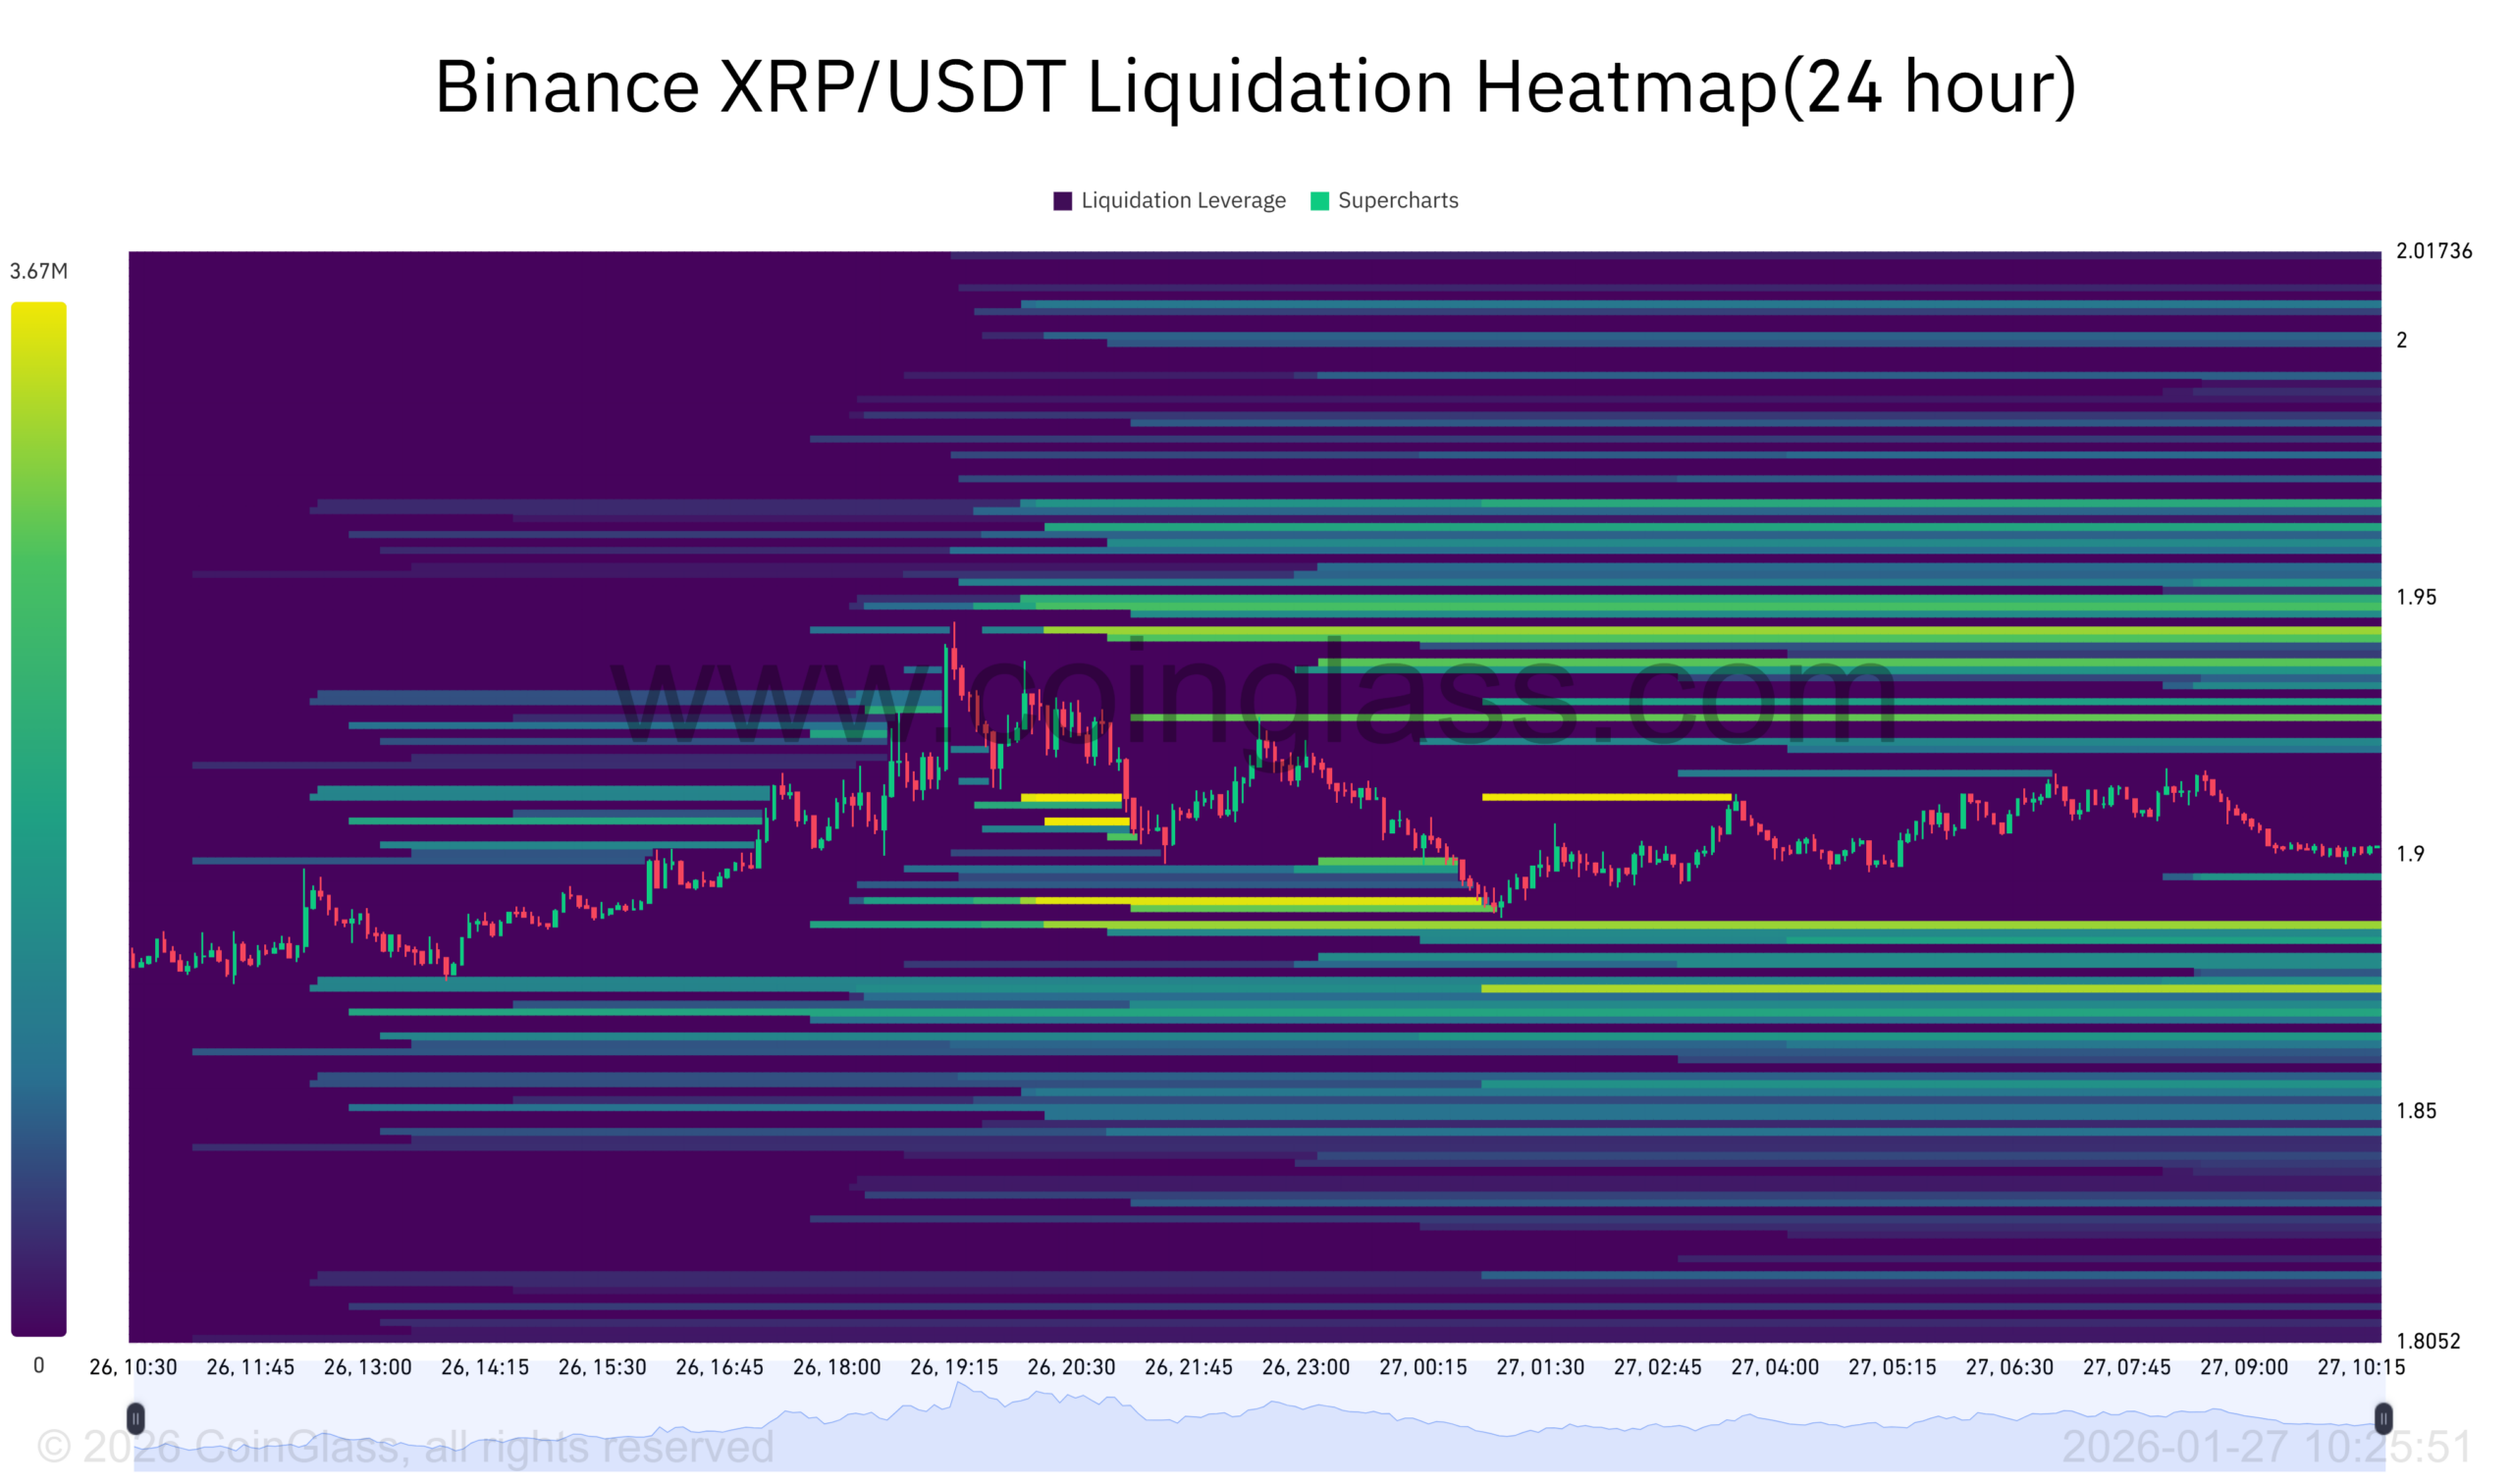
Price action drifts sideways near $1.90 while liquidity remains heavier below than above. This imbalance suggests downside risk carries more immediate impact.
If price slips into the lower liquidity pocket, long positions could unwind quickly, accelerating the move through cascading liquidations. The heatmap structure shows limited buffering once price enters these zones.
Meanwhile, overhead liquidity near $1.95 and above $2.00 remains intact, but price repeatedly fails to push into those levels with strength.
This behavior points to constrained upside while downside liquidity remains exposed.
Overall, the heatmap supports a setup where XRP faces liquidation-driven pressure if price breaks lower, reinforcing short-term downside vulnerability rather than sustained upside continuation.
Disclosure:This article does not contain investment advice or recommendations. Every investment and trading move involves risk, and readers should conduct their own research when making a decision.
Kriptoworld.com accepts no liability for any errors in the articles or for any financial loss resulting from incorrect information.

Tatevik Avetisyan is an editor at Kriptoworld who covers emerging crypto trends, blockchain innovation, and altcoin developments. She is passionate about breaking down complex stories for a global audience and making digital finance more accessible.
📅 Published: January 27, 2026 • 🕓 Last updated: January 27, 2026
