


The chart, created on December 11, 2025, shows XRP trading near 2.01 dollars while price forms a clear descending triangle pattern.
A descending triangle appears when a horizontal support level holds repeated tests while lower highs press from above.
Stay ahead in the crypto world – follow us on X for the latest updates, insights, and trends!🚀
Sellers step down each time, which keeps tightening the structure. This pattern usually signals continuation to the downside when support finally breaks.
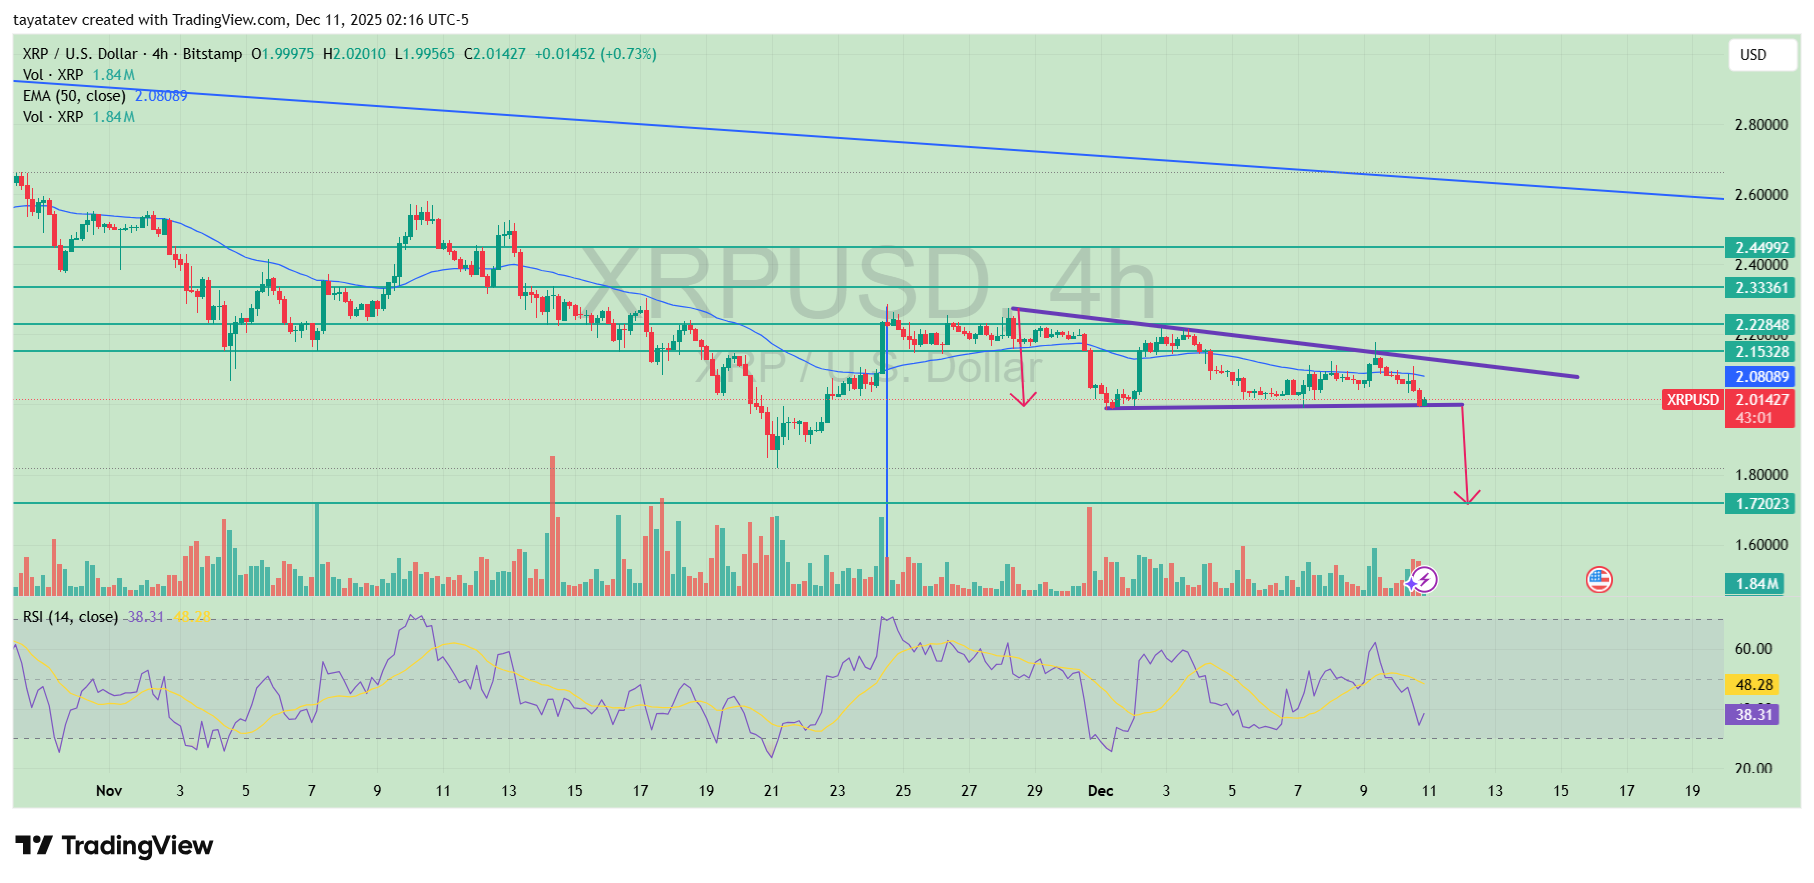
The support level sits around 2.00 dollars, and the down-sloping trendline pushes from 2.22 dollars toward 2.15 dollars.
Each bounce over the past two weeks has stalled at lower highs, so the pattern remains intact.
Volume also fades slightly during the consolidation, which fits how descending triangles normally behave before confirmation.
If XRP breaks below 2.00 dollars with a clean 4-hour close, the descending triangle would confirm. The measured move of this pattern equals the height of the triangle. That distance points to a drop of roughly 16 percent from the current zone.
A 16 percent decline from 2.01 dollars leads toward 1.72 dollars, which aligns with the horizontal level shown on the chart. This zone marks the next major support and fits the projected target.
However, if buyers defend 2.00 dollars and reclaim the descending trendline, XRP can move in the opposite direction.
A sustained break above 2.15328 dollars would invalidate the pattern. That move would show buyers gaining control and could open the path toward the next resistance around 2.22848 dollars.
Because of that, the trendline acts as a key marker. Until XRP clears it, pressure remains on the downside.
The chart still shows the pattern in place. XRP trades under the 50 EMA, and momentum indicators sit in the lower half of their ranges.
These conditions support the bearish structure while the triangle holds. Yet any strong bounce above 2.15328 dollars would shift the short-term outlook and remove the bearish setup.
XRP Potential Fractal on Long-Term Chart
Analyst Amonyx highlighted a potential XRP fractal based on a monthly chart shared by Gert van Lagen.
The chart lines up the 2014–2017 base and breakout with the 2018–2025 structure. In both cases, XRP builds a wide consolidation under a flat resistance level before price finally breaks higher.
The current range sits just above the old ceiling near 2 dollars, where several red crosses mark past failures and the latest successful breakout and retests.
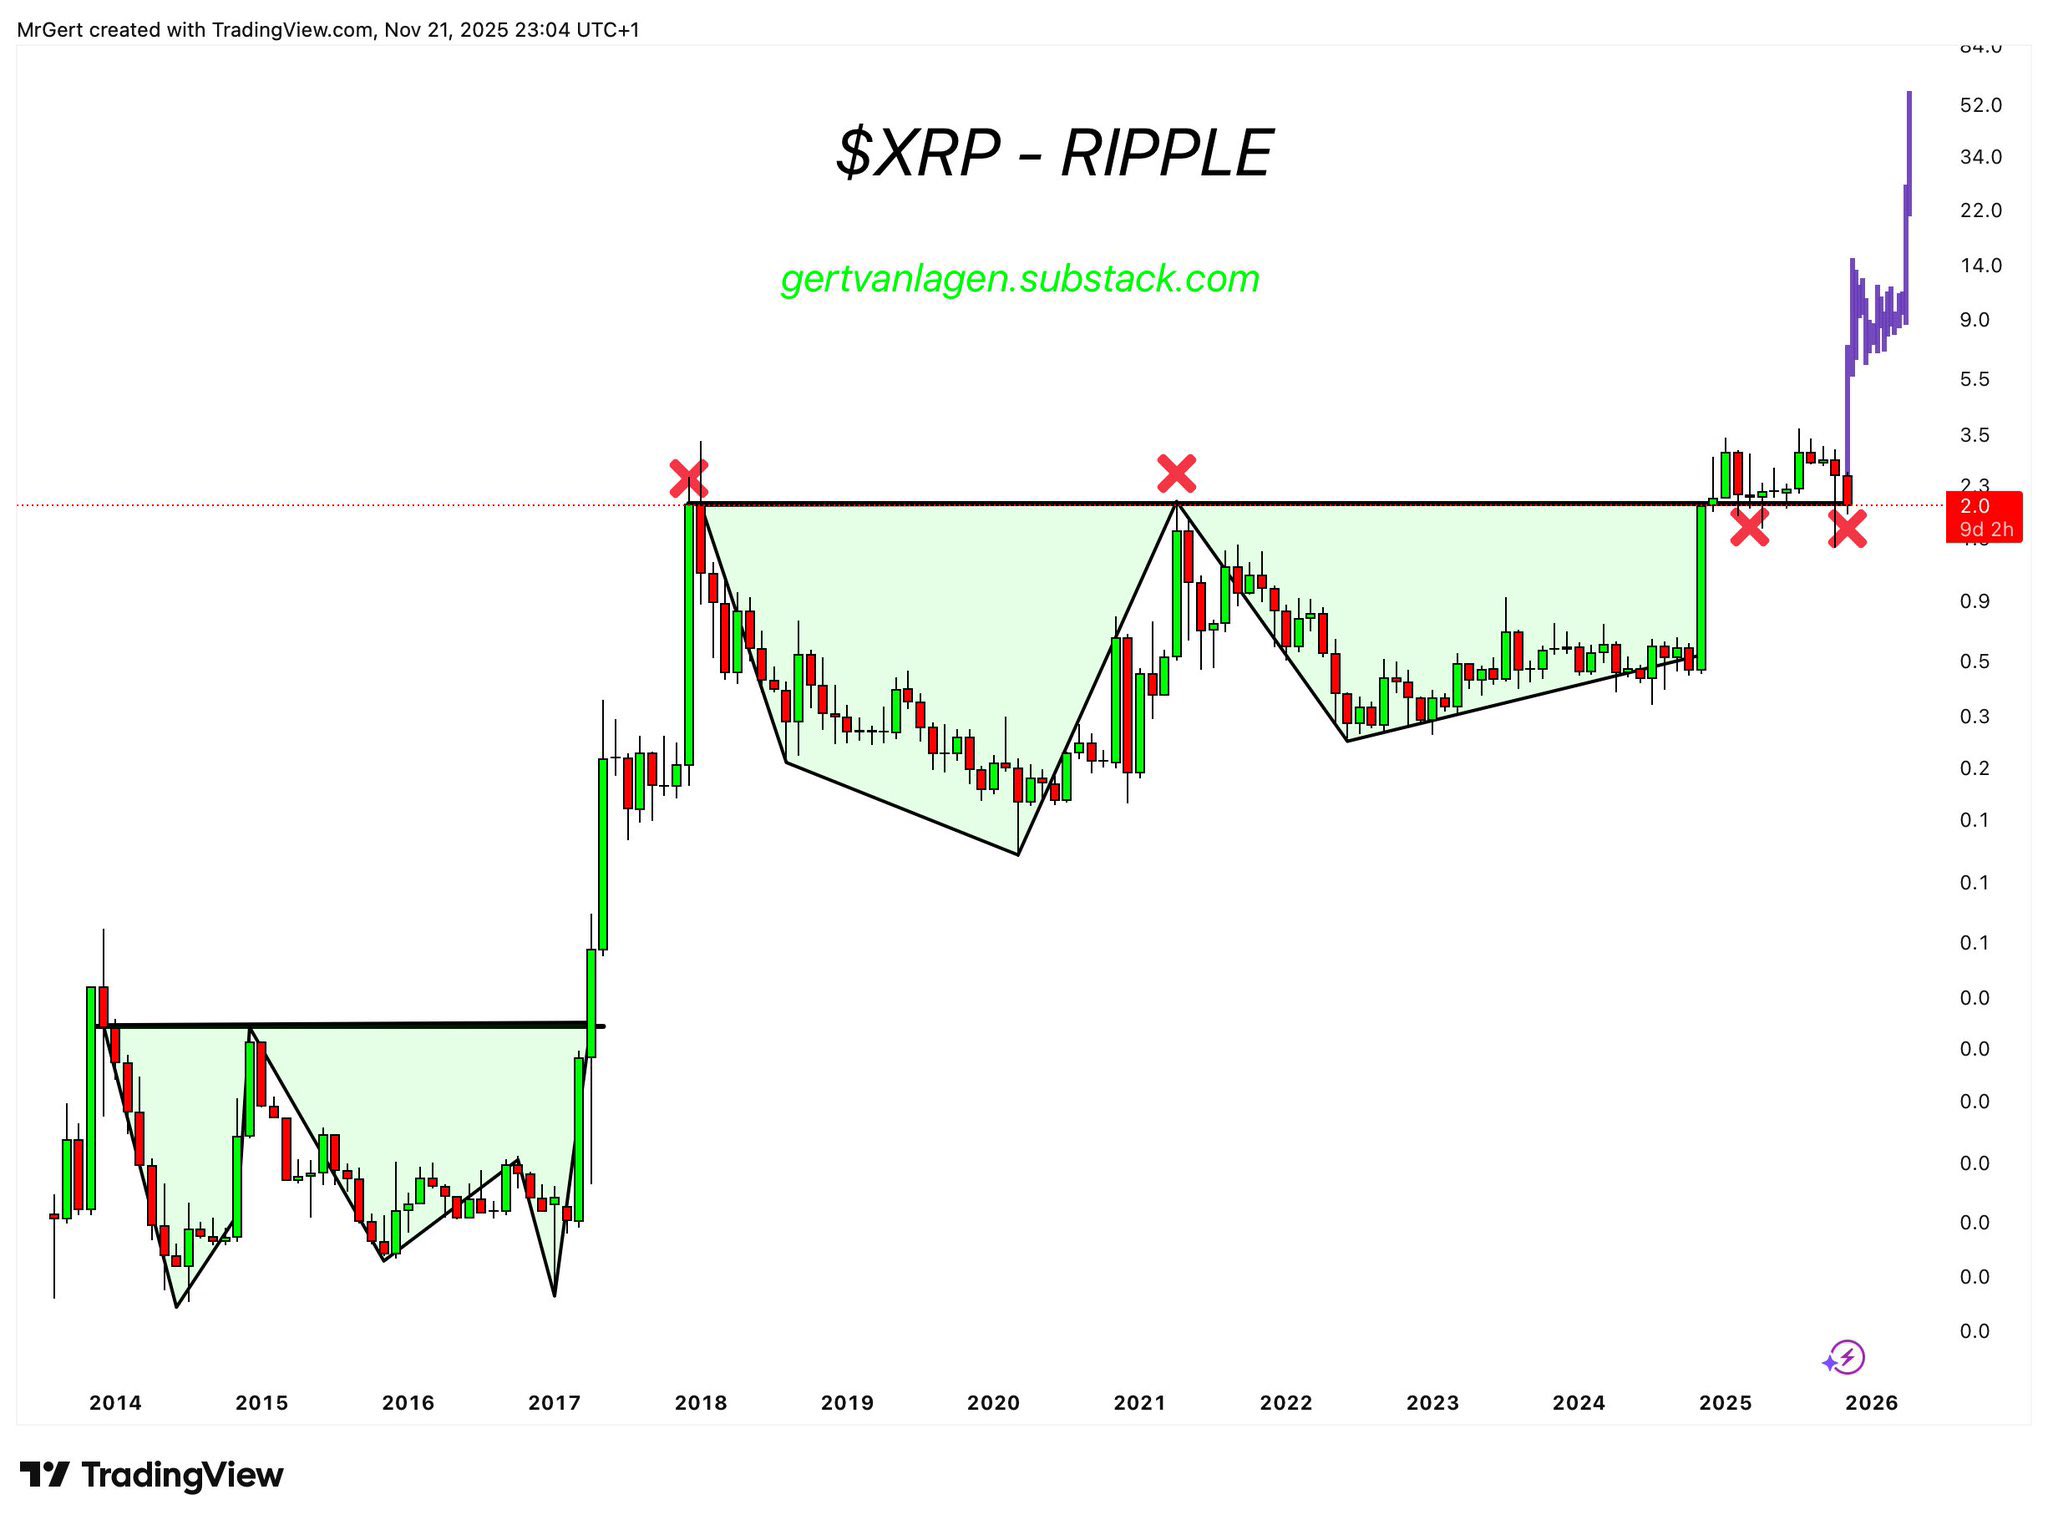
In the earlier cycle, XRP spent years moving sideways inside a shaded accumulation zone before a sharp vertical rally followed.
The new shaded area mirrors that behavior, with a long rounding pattern and higher lows pressing against the same type of horizontal cap.
Because of that, the chart suggests the market may be repeating its prior rhythm. The purple projection on the right visualizes how another strong leg up could look if the fractal continues to play out.
At the same time, the structure still depends on support holding above the former resistance band.
If XRP stays above that reclaimed level, the fractal thesis remains intact and the bullish comparison stays valid.
However, if price falls back under the old ceiling, the pattern would break, and the earlier cycle would no longer offer a reliable roadmap.
Disclosure:This article does not contain investment advice or recommendations. Every investment and trading move involves risk, and readers should conduct their own research when making a decision.
Kriptoworld.com accepts no liability for any errors in the articles or for any financial loss resulting from incorrect information.

Tatevik Avetisyan is an editor at Kriptoworld who covers emerging crypto trends, blockchain innovation, and altcoin developments. She is passionate about breaking down complex stories for a global audience and making digital finance more accessible.
📅 Published: December 11, 2025 • 🕓 Last updated: December 11, 2025
