


XRP traded near $1.894 on Dec. 16, 2025, after a TradingView chart timestamped 02:00 UTC-5 showed price holding below a falling resistance line and inside a bearish flag structure on the daily timeframe.
The session on the chart printed O $1.8977, H $1.8981, L $1.8526, C $1.8943, a small daily dip of about 0.17%.
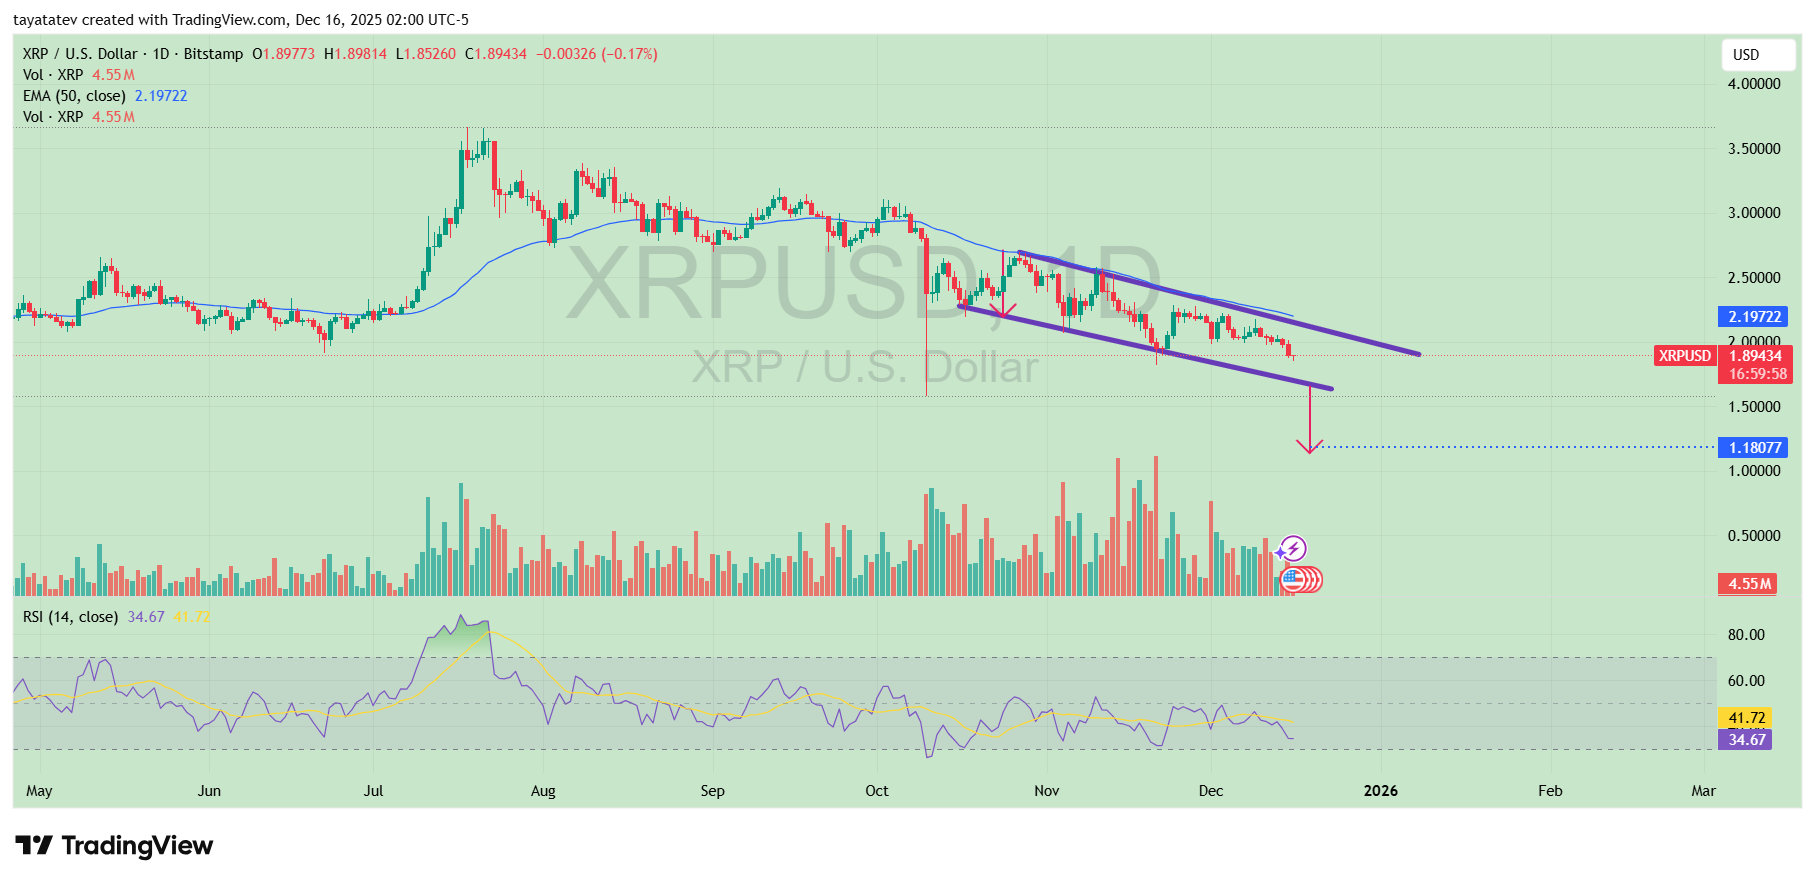
A bearish flag is a pause that forms after a sharp drop, where price consolidates in a tight channel before potentially continuing lower.
On this chart, the flag sits under the 50 day EMA near $2.197, keeping XRP below a key trend filter while the upper flag boundary continues to cap rebounds.
Stay ahead in the crypto world – follow us on X for the latest updates, insights, and trends!🚀
The drawing on the chart marks a downside continuation path if XRP breaks below the lower flag trendline and follow through confirms the move.
The projected level on the graphic points to about $1.1808, which implies a drop of roughly 38% from the current $1.894 area if the pattern resolves lower.
Momentum also leaned weak on the same setup. The RSI (14) sat near 34.7, keeping XRP close to the lower end of the typical 30–70 band and signaling that sellers still controlled the recent swing, even as volume on the panel showed about 4.55M XRP traded on the session.
XRP tests $1.92 support as 3 day chart warns of deeper drop
XRP traded near $1.97 in mid December as a 3 day chart shared by analyst Ali Charts highlighted $1.92 as a key support level that price must hold to prevent a sharper decline.
The chart, posted on Dec. 16, 2025, shows XRP trending lower from earlier highs near $3.27, with successive lower highs and accelerating downside pressure into year end.
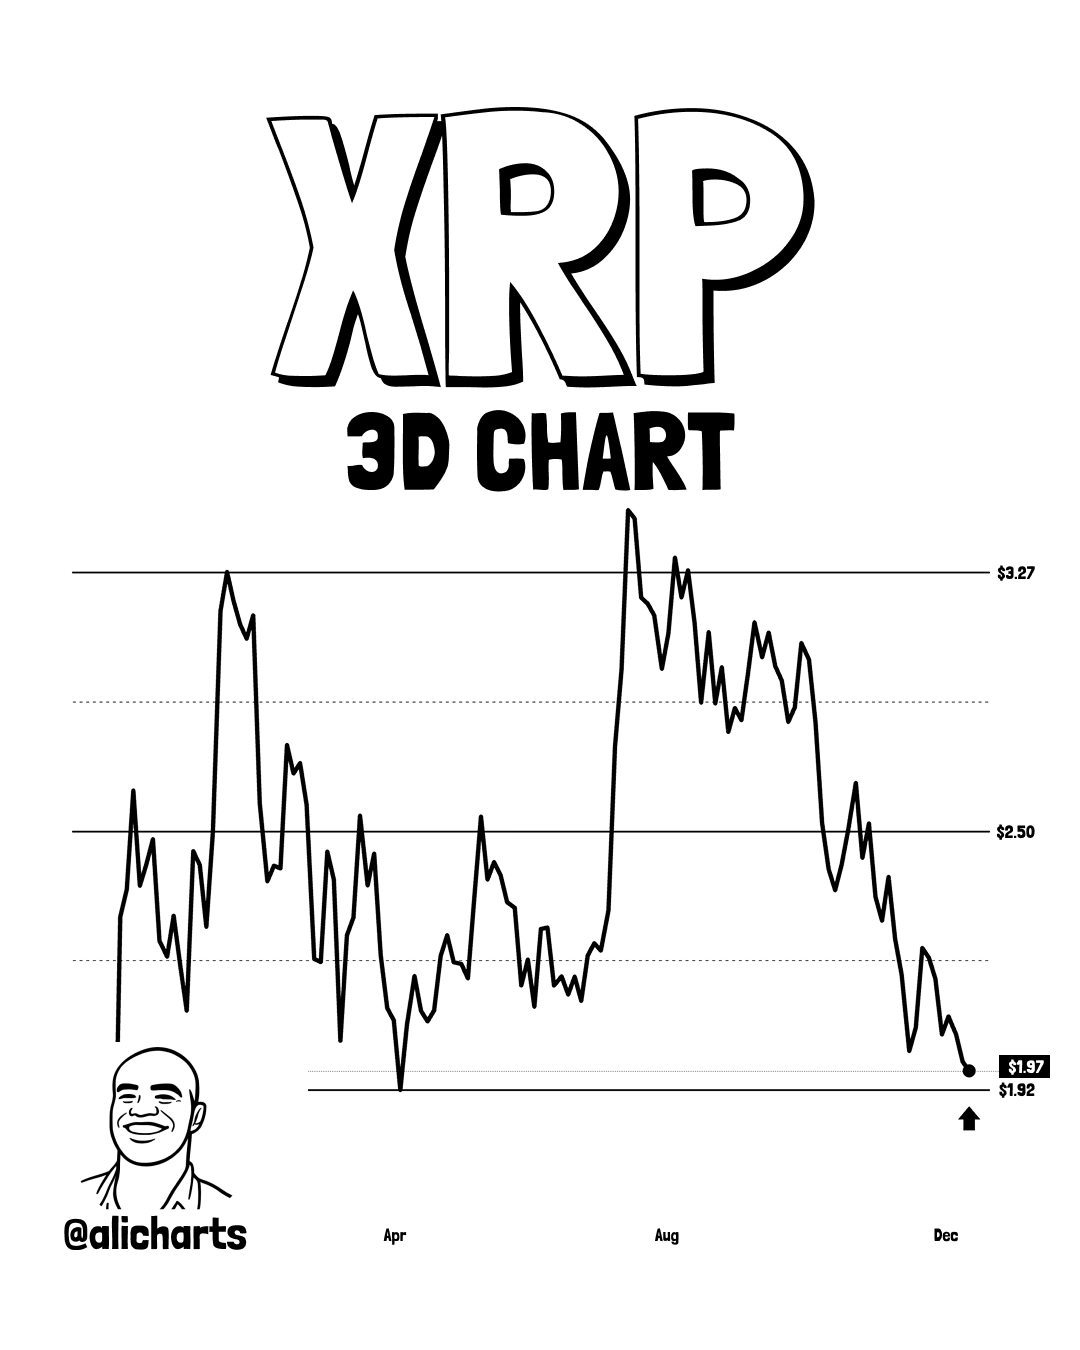
The graphic marks $1.92 as the last major horizontal support from prior consolidation zones earlier in the year.
According to the chart structure, a sustained break below that level would remove the final visible demand area on the timeframe.
In that case, the next downside reference on the chart sits near $1.00, implying a potential drop of roughly 48% from the $1.92 threshold.
Price action on the 3 day view also shows that recent rebounds failed near the $2.50 region, which previously acted as both support and resistance.
That rejection reinforced the broader bearish structure and left XRP sliding back toward the lower boundary of its yearly range, where volatility has started to compress near support.
Ali Charts summarized the risk clearly, stating that $1.92 is the level XRP must hold to avoid a drop to $1.
The chart does not show reversal signals at this stage, and the structure suggests that holding this zone remains critical for preventing a deeper downside extension.
XRP funding flips negative as Coinglass heatmap shows downside liquidity cleared
A trader posting as Niels (@Web3Niels) said XRP “downside liquidity has been completely taken out” as a Coinglass liquidity heatmap showed price grinding lower through early to mid December and spending long stretches near the $2.00 area.
The chart spans roughly Dec. 1 to Dec. 15 and plots XRP moving inside a tight band, with repeated tests of lower levels after earlier bounces faded.
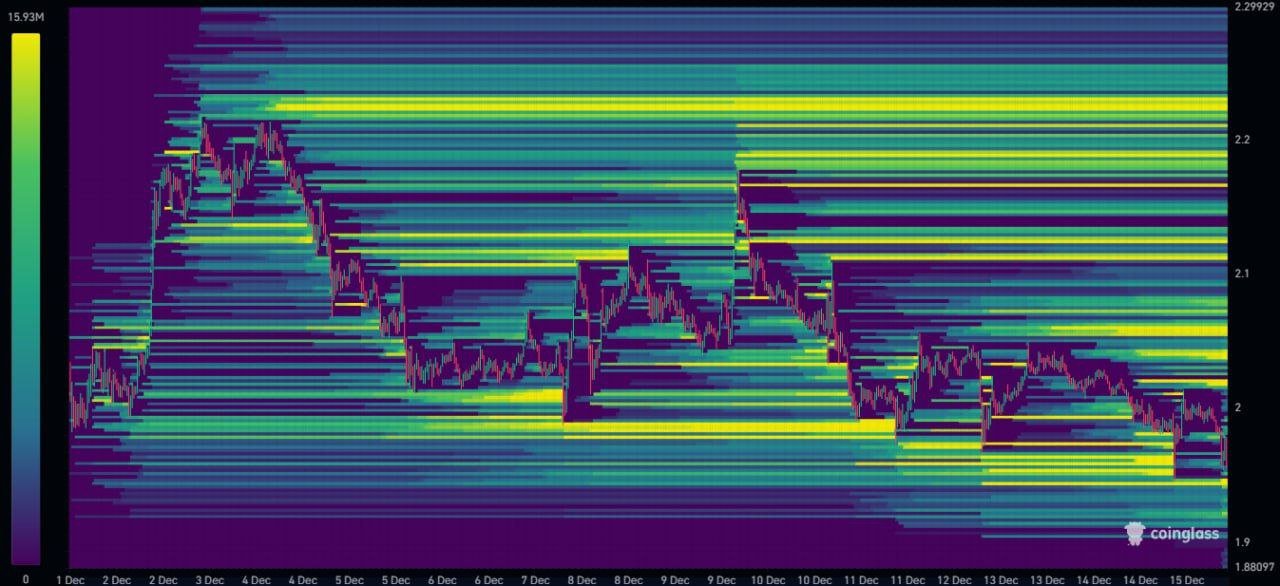
On the heatmap, the brightest horizontal bands represent thicker liquidity sitting at specific prices. The image shows much of the strongest remaining bands clustered above spot during several periods, while price continued to step down and revisit lower zones.
Niels framed that as downside liquidity being “taken out,” meaning the market has already traded through many nearby downside pools that often attract price during a drop.
Niels also said XRP’s funding rate across exchanges flipped negative, which typically signals that short positions dominate and shorts pay longs to hold trades.
He argued that when positioning becomes one sided, markets often move the other way to force exits, and he added that even a small broader market bounce could trigger an XRP short squeeze as shorts rush to cover.
Disclosure:This article does not contain investment advice or recommendations. Every investment and trading move involves risk, and readers should conduct their own research when making a decision.
Kriptoworld.com accepts no liability for any errors in the articles or for any financial loss resulting from incorrect information.

Tatevik Avetisyan is an editor at Kriptoworld who covers emerging crypto trends, blockchain innovation, and altcoin developments. She is passionate about breaking down complex stories for a global audience and making digital finance more accessible.
📅 Published: December 16, 2025 • 🕓 Last updated: December 16, 2025
