


Shiba Inu (SHIB) traded near 0.00000780 USDT on the daily Binance chart shared on TradingView on Dec. 16, 2025 (03:15 UTC-5), while price stayed trapped inside a bearish flag and below falling trend resistance.
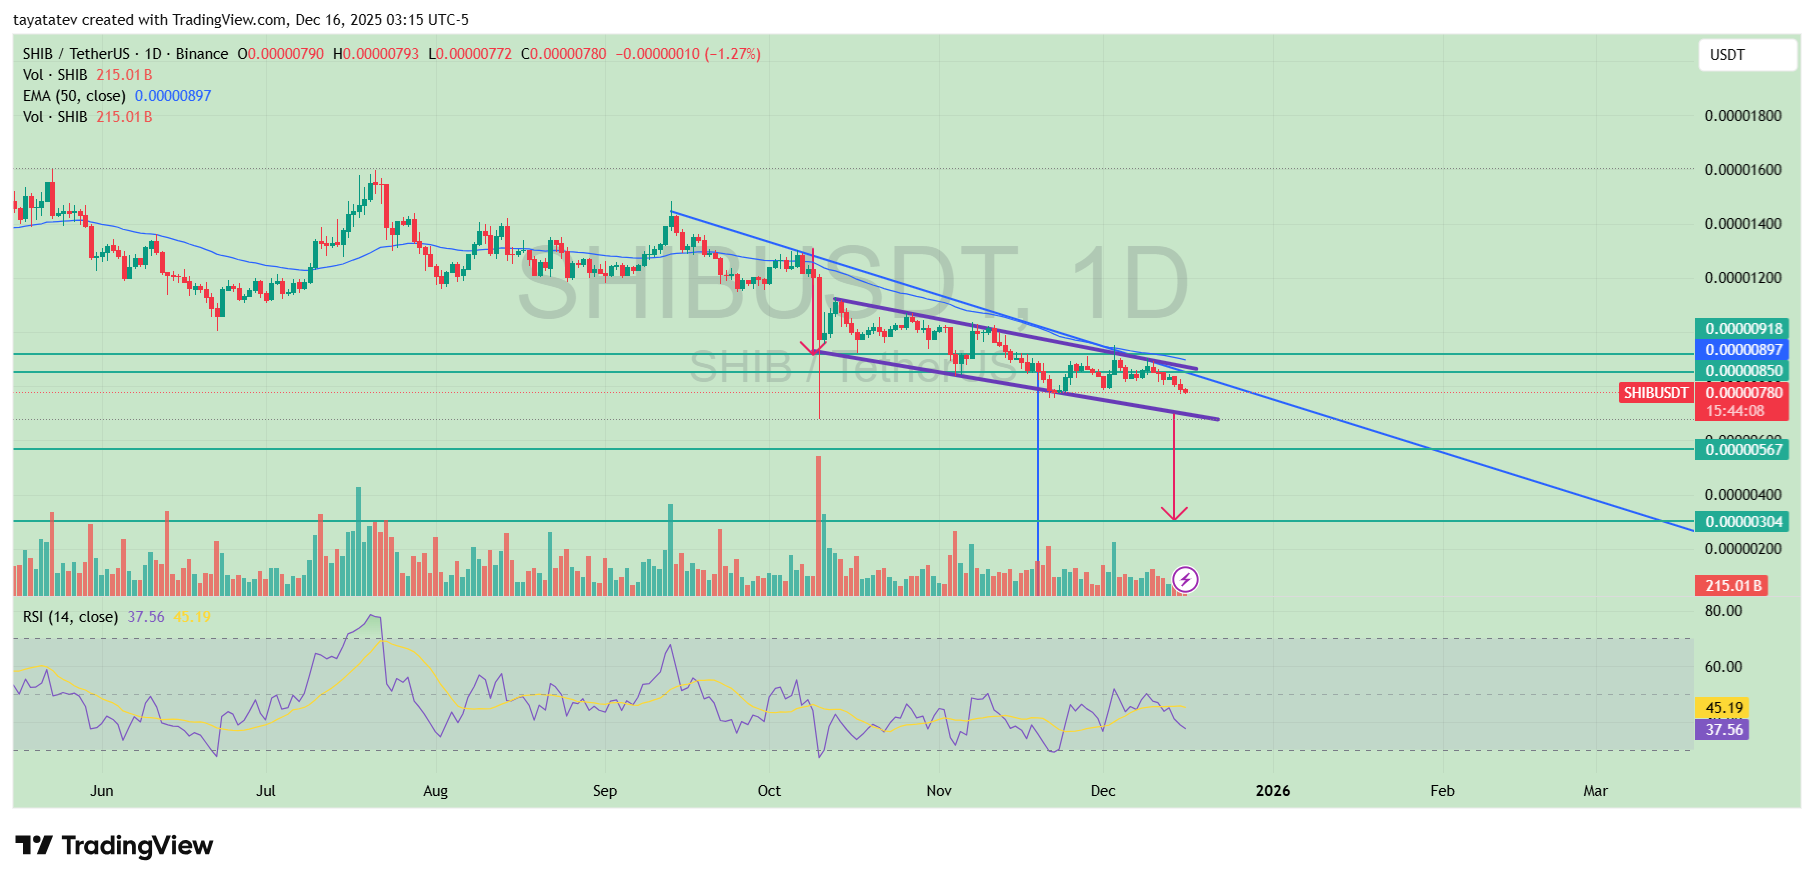
A bearish flag usually forms after a sharp drop, then price drifts sideways to slightly higher inside a tight channel.
However, the structure often acts as a pause, not a reversal, because sellers keep control while price fails to reclaim key resistance.
On this chart, the “flag” sits under the 50-day EMA near 0.00000897, and the upper trendlines continue to cap rebounds.
At the same time, the lower boundary of the flag keeps getting tested, which shows buyers defend the range but cannot push price back above the key levels around 0.00000850–0.00000918.
If SHIB confirms the bearish flag with a clean breakdown below the lower flag support, the next downside area on the chart sits near 0.00000567.
After that, the chart’s projected move points to 0.00000304, which is about 61% below 0.00000780.
Momentum also leaned weak on the same layout. The RSI (14) sat near 37.56, which stayed below the neutral 50 level and matched the broader downtrend while SHIB remained pinned under declining resistance.
SHIB dominance chart signals potential bullish expansion after multi year downtrend
Meanwhile, Shiba Inu’s market cap dominance traded near 0.1619% on the daily CRYPTOCAP chart, according to a TradingView visual shared by X user Random (@_RNDM_7).
The chart tracks SHIB dominance from 2021 through late 2025 and shows price compressing at the lower edge of a long falling channel.
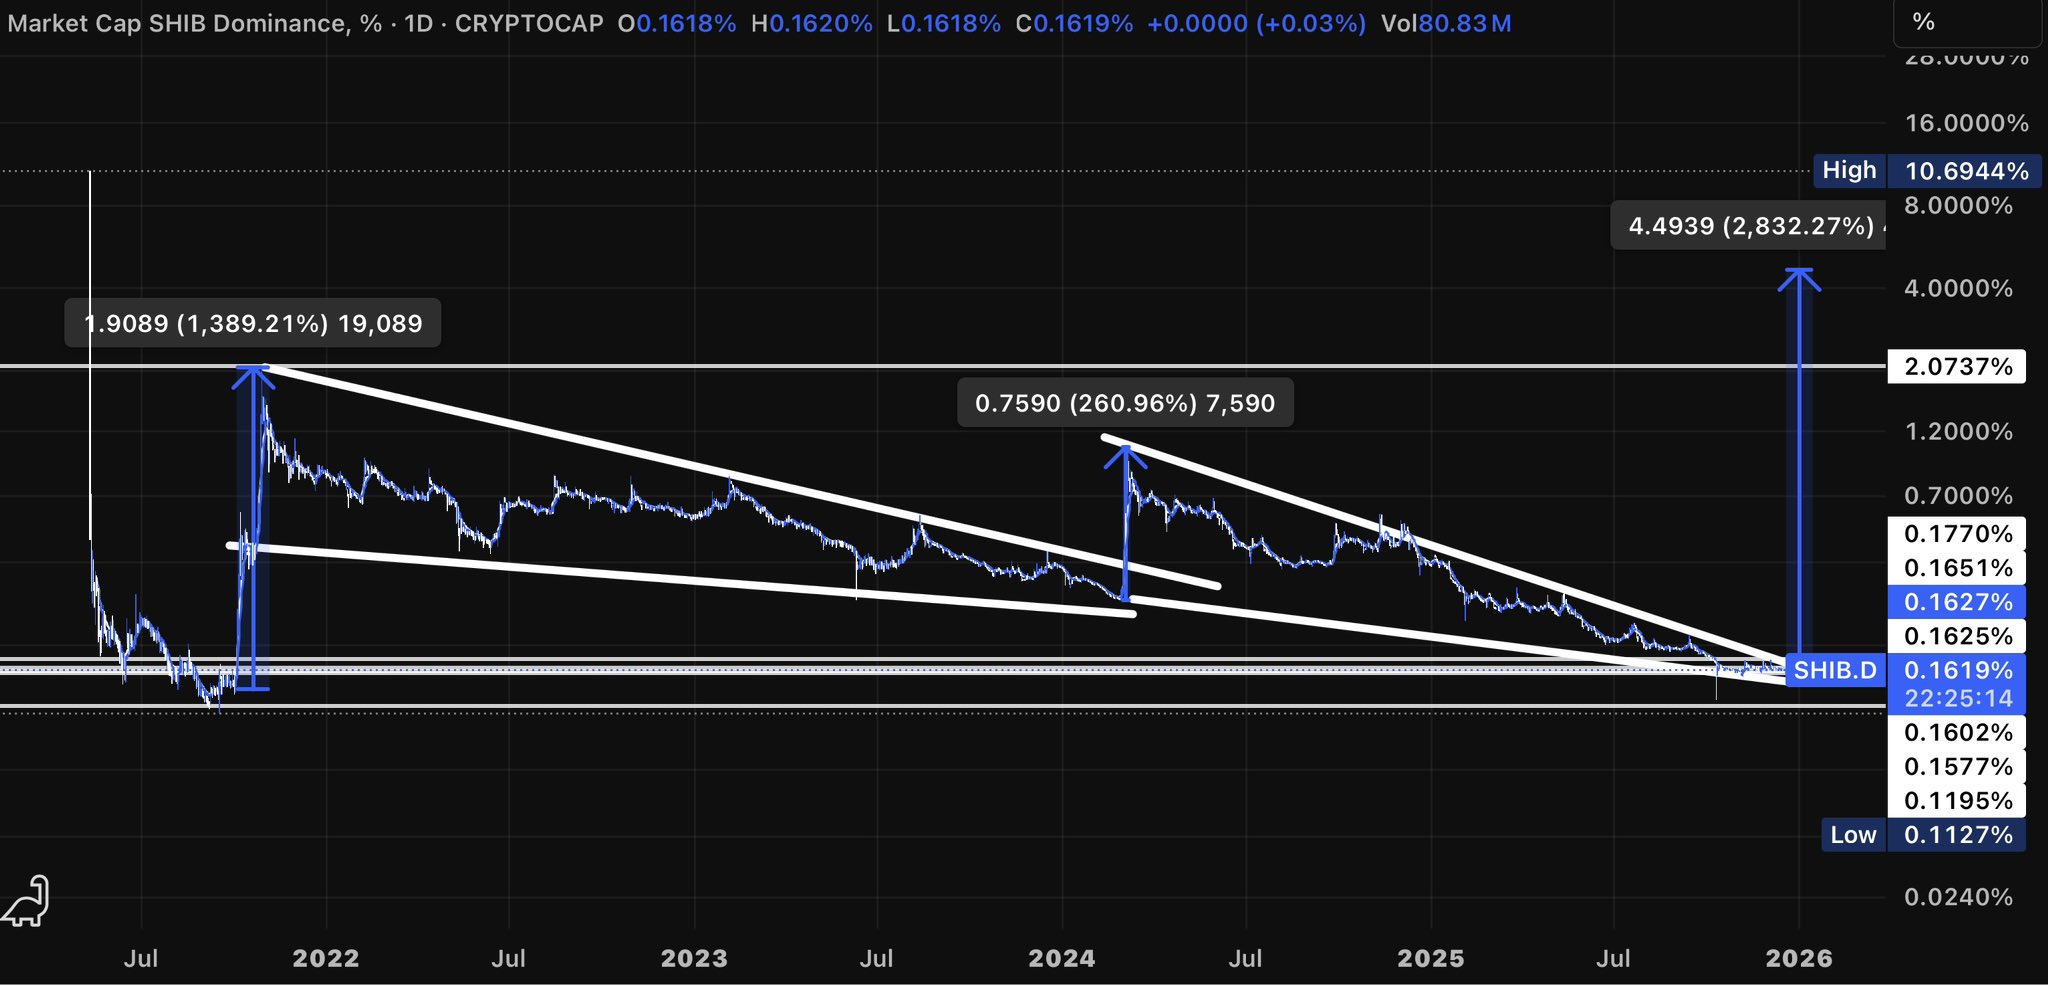
Market cap dominance measures how much of the total crypto market value belongs to one asset. When dominance rises, it means the asset gains relative strength versus the broader market, even if overall prices remain volatile.
On this chart, SHIB dominance has moved inside a descending channel since its 2021 peak near 10.69%. Each major cycle inside the channel produced sharp upside spikes before dominance rolled over again.
The first rally lifted dominance by about 1,389%, while the second surge reached roughly 261%, based on the marked moves.
SHIB dominance now sits at the lower boundary of that same structure, near a historical support zone around 0.16%.
Previous tests of this area acted as launch points for strong upside moves, as shown by the vertical projections on the chart.
The latest compression suggests selling pressure has weakened as dominance holds above long term lows.
If dominance breaks above the descending resistance line, the chart projection points toward a move into the 2% to 4.4% range.
That would mark a significant relative expansion versus the broader crypto market and align with past dominance breakouts shown on the same layout.
The structure does not rely on short term momentum indicators. Instead, it highlights long cycle positioning, where SHIB dominance stabilizes after extended declines.
As long as dominance holds above the lower support band, the chart keeps a bullish breakout scenario in play based on historical behavior.
Disclosure:This article does not contain investment advice or recommendations. Every investment and trading move involves risk, and readers should conduct their own research when making a decision.
Kriptoworld.com accepts no liability for any errors in the articles or for any financial loss resulting from incorrect information.

Tatevik Avetisyan is an editor at Kriptoworld who covers emerging crypto trends, blockchain innovation, and altcoin developments. She is passionate about breaking down complex stories for a global audience and making digital finance more accessible.
📅 Published: December 16, 2025 • 🕓 Last updated: December 16, 2025
