


XRP’s current structure began right after the July surge. The bull flag started on July 20, 2025 (the first session after the ~$3.56 spike on the chart).
Price has since drifted lower inside a neat, downward-sloping channel while holding the bulk of June–July gains. The pole is the sharp June–July advance from roughly $2.00 to $3.56.
Stay ahead in the crypto world – follow us on X for the latest updates, insights, and trends!🚀
Since mid-July, candles respected two parallel trendlines. Sellers pushed into the upper band several times but failed to force a full breakdown.
Meanwhile, buyers absorbed dips near the lower rail and around the October capitulation wick. Therefore, the pattern preserved higher-time-frame upside while working off momentum.
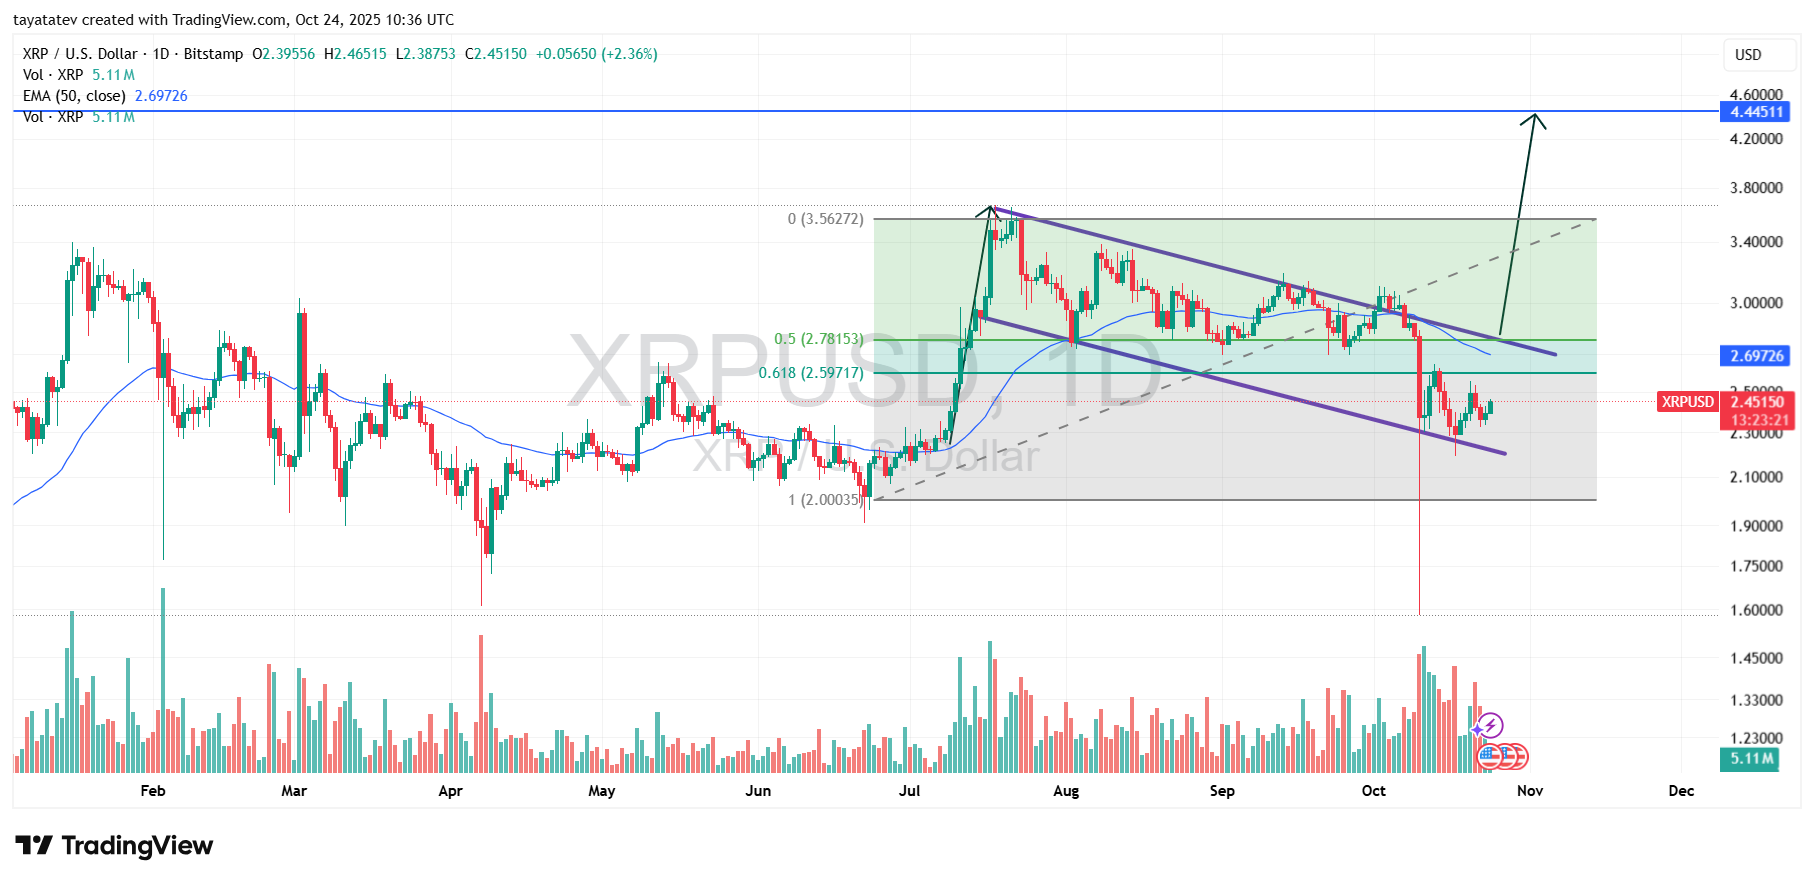
Today’s snapshot shows XRP near $2.45 with the 50-day EMA ~ $2.70 above price. The upper flag line sits just overhead; a decisive close through it would be the first hard signal that the consolidation is ending.
What a bull flag means
A bullish flag is a continuation setup. After a strong rally (the “pole”), price consolidates in a tight, downward channel (the “flag”).
The sloping pause cools momentum and resets indicators without conceding the prior advance.
Confirmation requires a clean breakout above the flag’s upper trendline on expanding volume. Ideally, price also reclaims a short/medium moving average to demonstrate trend resumption. Until that break, the structure is only potential energy.
Once confirmed, technicians measure the next leg by projecting the height of the pole from the breakout area.
The result gives a probabilistic target—never a guarantee—but it frames risk and reward.
Measured move and 81% projection
From the current price near $2.45, an 81% rally projects to ~$4.44. Calculation: $2.45 × 1.81 ≈ $4.44. That target aligns with the horizontal level already marked around $4.445 on the chart, reinforcing confluence.
However, the path runs through resistance. First, XRP must close above the upper flag line and then sustain above the 50-day EMA (~$2.70). These steps often trigger follow-through as sidelined buyers re-enter.
If confirmed, the measured move would mirror the pole’s magnitude and carry price back into the high-$3s to low-$4s zone, where prior supply sits.
Indicators, trend, and confirmation triggers
Trend: The 50-day EMA (~$2.70) caps price. Reclaiming it would flip near-term momentum and turn the EMA into support. A second higher high above the late-September swing would strengthen trend evidence.
Volume: During the flag, activity typically contracts, then expands on breakout. Watch for a visible expansion day as price clears the upper rail. That is the quality signal distinguishing a real break from a wick.
Market structure: October’s long downside wick washed out weak hands but failed to close below the flag base. That behavior often precedes successful breaks, provided bulls quickly recapture moving averages.
Fibonacci checkpoints to watch
The chart anchors Fibonacci retracements from the ~$2.00 swing low to the ~$3.56 high. The 0.618 sits near $2.597, and the 0.5 near $2.782. These are classic “value” zones inside healthy pullbacks.
Therefore, the first staging goal after a breakout is to reclaim $2.597 (0.618) and then $2.781 (0.5) on closing bases. Holding above those levels signals buyers control the retracement.
Beyond that, the pre-flag high near $3.56 becomes the gateway. A weekly close through the high often accelerates toward the measured objective in the low-$4s.
Invalidation and risk
The setup fails if XRP loses the lower flag boundary on a daily close and cannot recover quickly.
On this chart, that rail tracks around the low-$2.30s. A decisive break and acceptance below it would turn the pattern into a broader down-channel rather than a flag.
Additionally, repeated rejections at the upper rail without volume expansion would keep XRP range-bound. In that case, expect more chop between the EMA and the lower band until a fresh catalyst arrives.
As always, the measured move is a projection, not a promise. Price must first confirm the breakout above the flag and the 50-day EMA; only then does the ~$4.44 (+81%) path become active.
Disclosure:This article does not contain investment advice or recommendations. Every investment and trading move involves risk, and readers should conduct their own research when making a decision.
Kriptoworld.com accepts no liability for any errors in the articles or for any financial loss resulting from incorrect information.

Tatevik Avetisyan is an editor at Kriptoworld who covers emerging crypto trends, blockchain innovation, and altcoin developments. She is passionate about breaking down complex stories for a global audience and making digital finance more accessible.
📅 Published: October 24, 2025 • 🕓 Last updated: October 24, 2025
