

 Bearish Flag Pattern Signals Major Breakdown — Price Could Drop 71%")
Dogecoin’s daily chart dated Oct 28, 2025, shows a bearish flag forming after the sharp January–March drop.
Price trades near $0.2018 while the 50-day EMA sits higher around $0.218. This setup places price under trend resistance and close to the flag’s lower boundary.
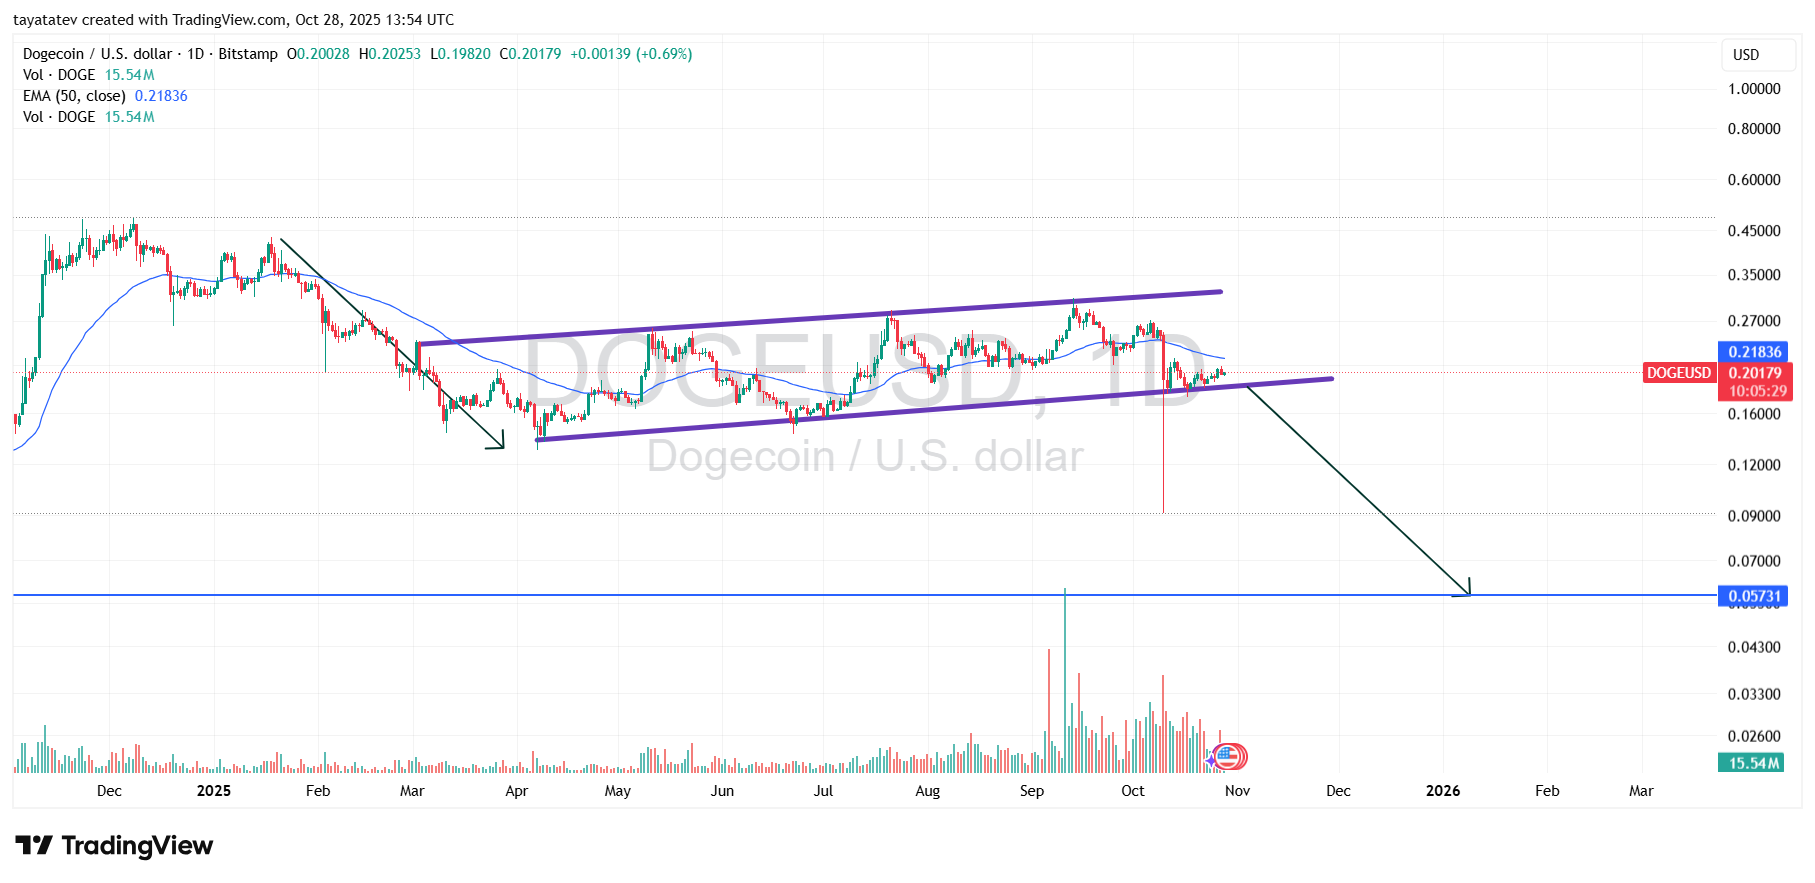
A bearish flag pattern appears when price sells off hard (the flagpole) and then grinds higher or sideways inside a tight, upward-sloping channel (the flag).
Volume often fades inside the channel. Sellers aim to confirm the pattern with a decisive breakdown below the lower trendline, ideally on rising volume.
Here, the prior impulse down created the pole; the April–October channel built the flag. Volume cooled through the range, which fits the textbook behavior. Moreover, price struggles below the 50-day EMA and rides the lower rail, which increases breakdown risk.
If confirmation comes with a daily close below the flag support and follow-through, the measured move projects the pole’s height from the breakdown point.
Stay ahead in the crypto world – follow us on X for the latest updates, insights, and trends!🚀
That projection implies a ~71% decline from the current $0.2018, targeting ~$0.0585 as the next major level.
Risk markers remain clear. A clean reclaim of the 50-day EMA and a push back to the channel midline would delay the signal.
However, as long as price stays capped beneath the EMA and the lower rail bends down, sellers control the structure.
Therefore, confirmation below support would validate the bearish flag and keep the ~$0.0585 objective in focus.
Dogecoin MACD Analysis — Oct 28, 2025
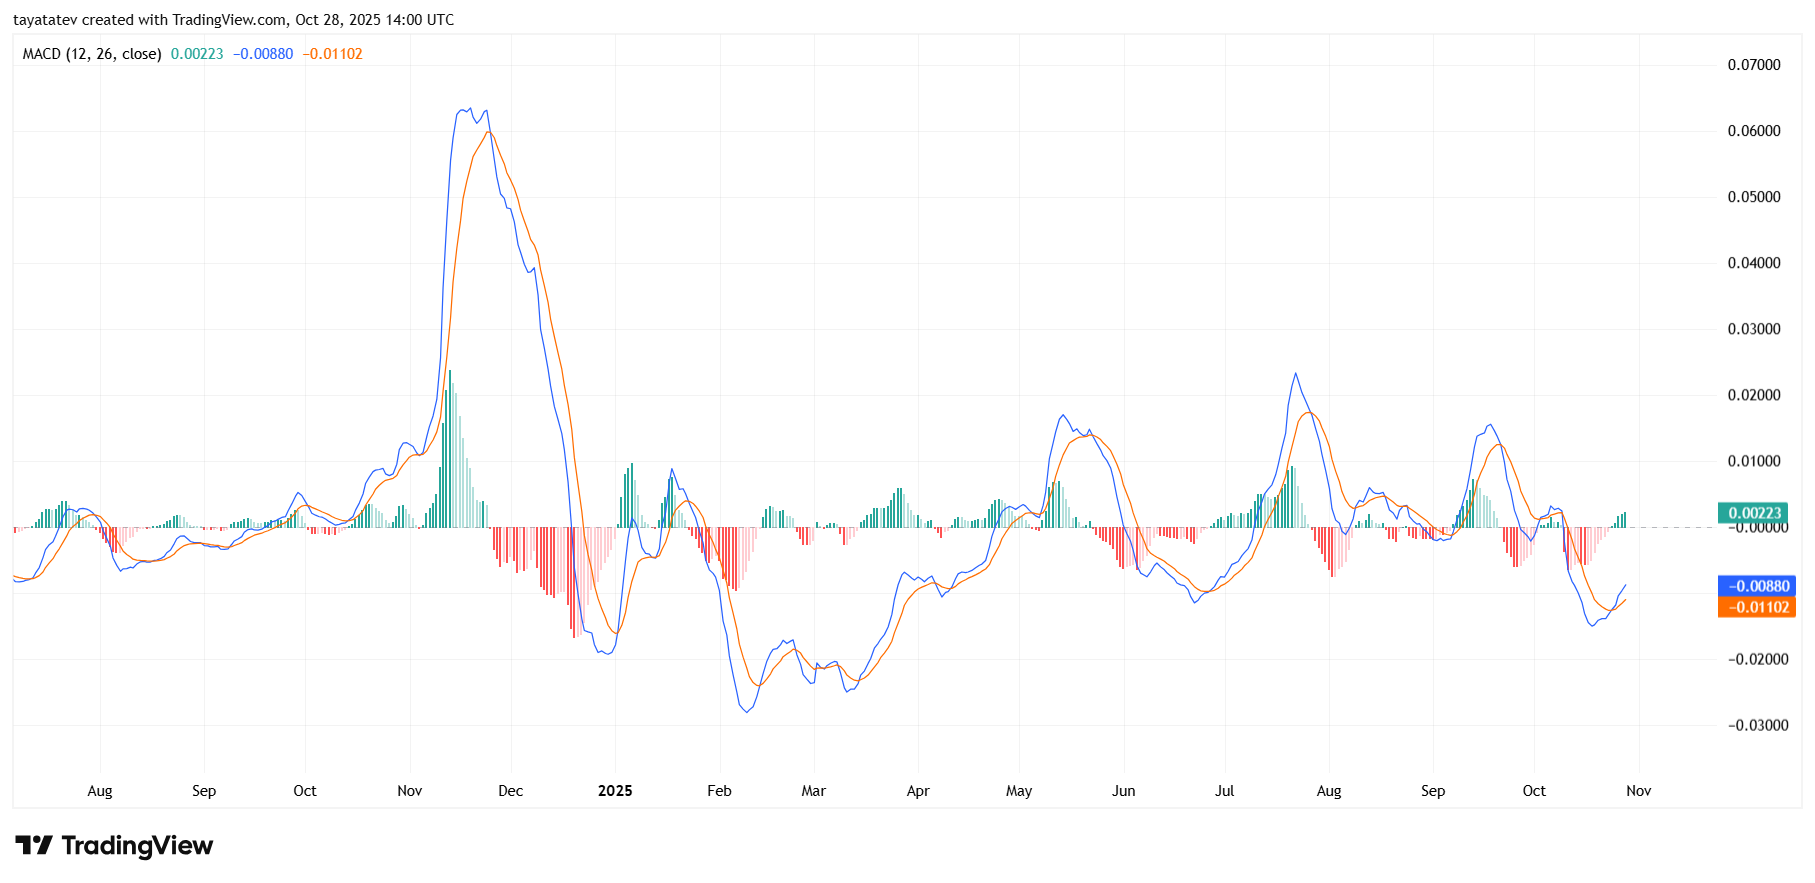
The MACD (Moving Average Convergence Divergence) chart for Dogecoin (DOGE/USD) dated October 28, 2025, shows early momentum recovery after a prolonged neutral-to-bearish phase.
The MACD line (blue) sits slightly above the signal line (orange), printing a small positive histogram near 0.00223, signaling mild bullish pressure.
The MACD helps identify momentum shifts. It consists of the MACD line, signal line, and histogram.
A crossover above the signal line often suggests a short-term bullish phase, while a crossover below it signals selling strength.
The histogram visualizes this difference, growing green during bullish phases and red during bearish moves.
Throughout mid-2025, Dogecoin’s MACD reflected repeated weak rebounds that quickly faded. Peaks in April, July, and August corresponded to short rallies before momentum cooled.
Now, in late October, the MACD has crossed slightly into positive territory, but both lines remain near zero — a zone that usually reflects uncertainty rather than strong trend reversal.
This aligns with the broader chart, where DOGE struggles near the lower boundary of its bearish flag.
For confirmation, traders will watch whether the MACD line continues upward and widens above the signal line.
If it turns down again while the histogram shrinks, that would reinforce the bearish flag breakdown view from the price chart.
In short, momentum remains fragile and only modestly positive, consistent with a market testing short-term support before deciding direction.
Disclosure:This article does not contain investment advice or recommendations. Every investment and trading move involves risk, and readers should conduct their own research when making a decision.
Kriptoworld.com accepts no liability for any errors in the articles or for any financial loss resulting from incorrect information.

Tatevik Avetisyan is an editor at Kriptoworld who covers emerging crypto trends, blockchain innovation, and altcoin developments. She is passionate about breaking down complex stories for a global audience and making digital finance more accessible.
📅 Published: October 28, 2025 • 🕓 Last updated: October 28, 2025
