


A crypto commentator alleged that Binance is “non-stop dumping” Bitcoin and Ether ahead of today’s Federal Reserve remarks.
The post from @CryptoNobler said the exchange is selling “millions every few minutes” to force long liquidations.
Stay ahead in the crypto world – follow us on X for the latest updates, insights, and trends!🚀
Meanwhile, BTC/USDT traded near $107,800 on Binance after touching an intraday low around $107,480.
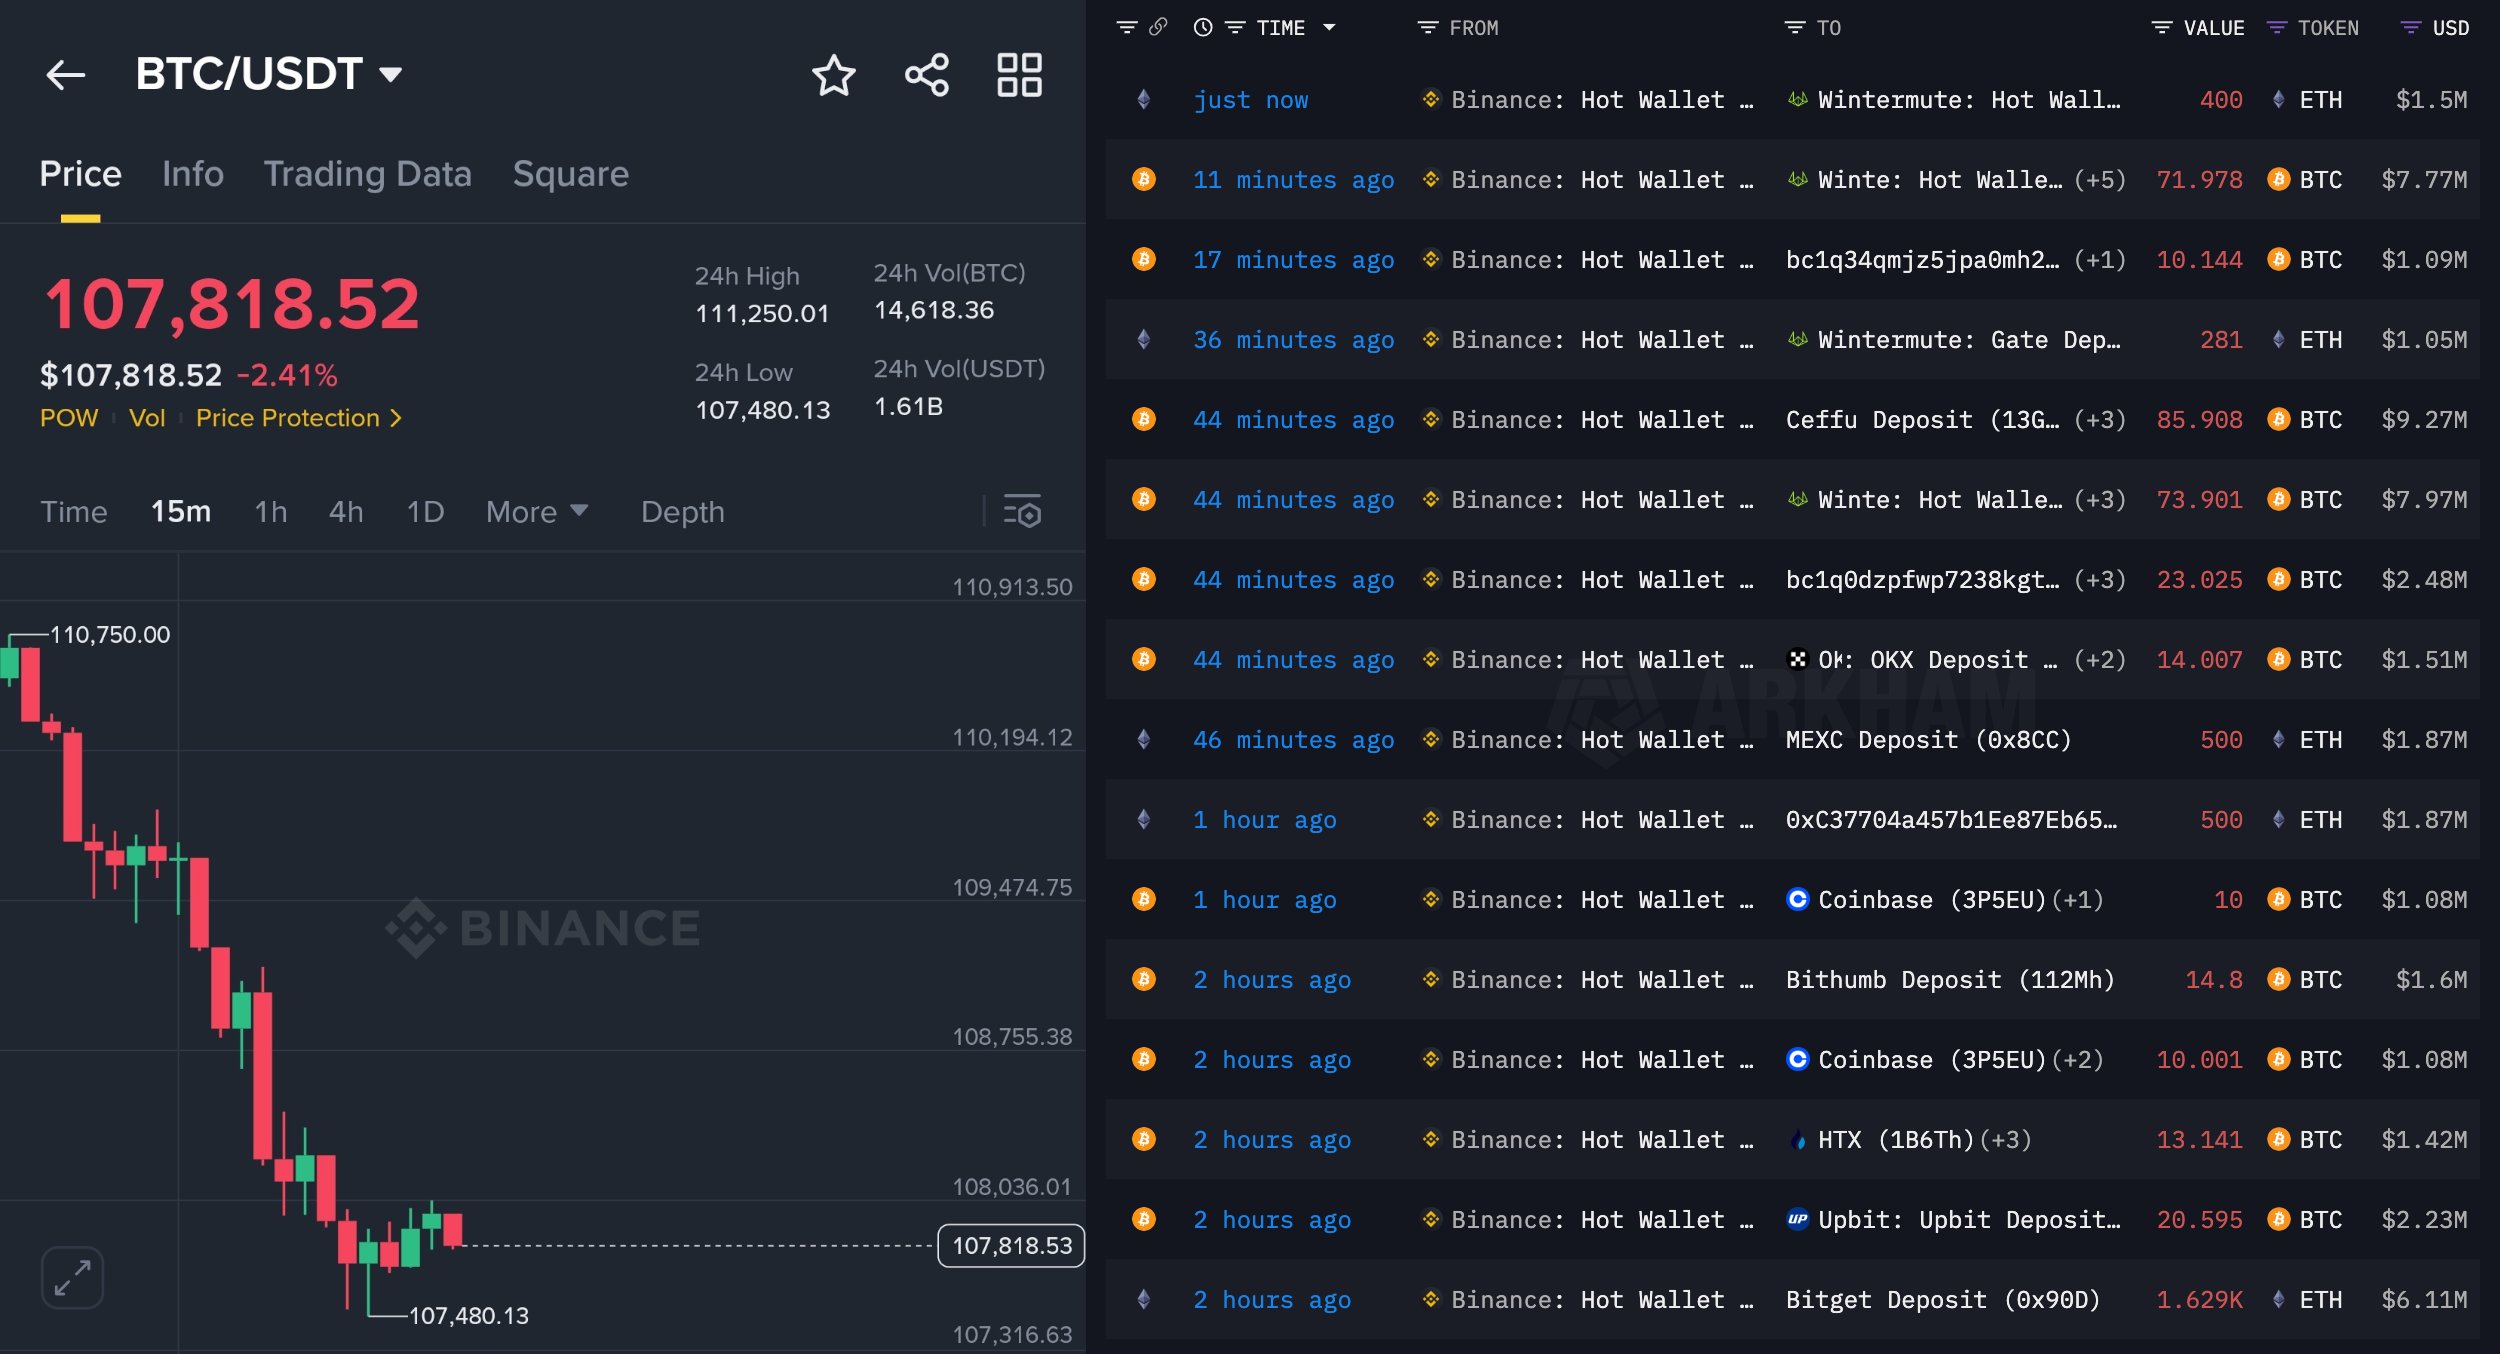
Large transfers from Binance hot wallets to market-making and exchange addresses occurred within the past two hours.
The allegation of deliberate manipulation remains unverified. Exchanges regularly rebalance and route assets between internal and external wallets, and such movements can overlap with volatility.
Even so, the pre-Fed timing kept focus on order-book pressure and potential long liquidations.
Ethereum MVRV cools as price nears realized value
Ethereum’s MVRV ratio keeps falling from recent highs, signaling profit-taking has eased while risk remains.
The realized price trend still climbs slowly, but spot price now moves closer to that baseline, narrowing the cushion that bulls enjoyed earlier.
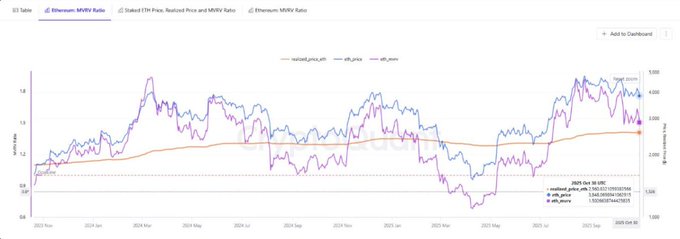
Historically, MVRV above extended levels preceded pullbacks as holders sat on large unrealized gains.
Now, the ratio retreats toward the neutral 1.0 zone, which often marks a fair-value area. When MVRV dipped below 1.0 in past cycles, it aligned with capitulation phases and later recoveries.
For now, ETH trades above realized price, yet the gap has compressed. This setup points to a market that is resetting leverage and expectations before the next catalyst.
If MVRV stabilizes near 1.0 while realized price keeps rising, downside pressure can fade. However, if price slips under realized price, the market could test deeper support as underwater supply grows.
Ethereum prints falling wedge on Nov. 3, 2025 (1D, Bitstamp)
Ethereum traded near $3,728 on Nov. 3, 2025, on the daily Bitstamp chart, while the 50-day EMA sat around $4,062 and RSI hovered near 40.
The structure forms a falling wedge—two downward-sloping, converging trendlines that often precede a bullish reversal when price breaks out above the upper line.
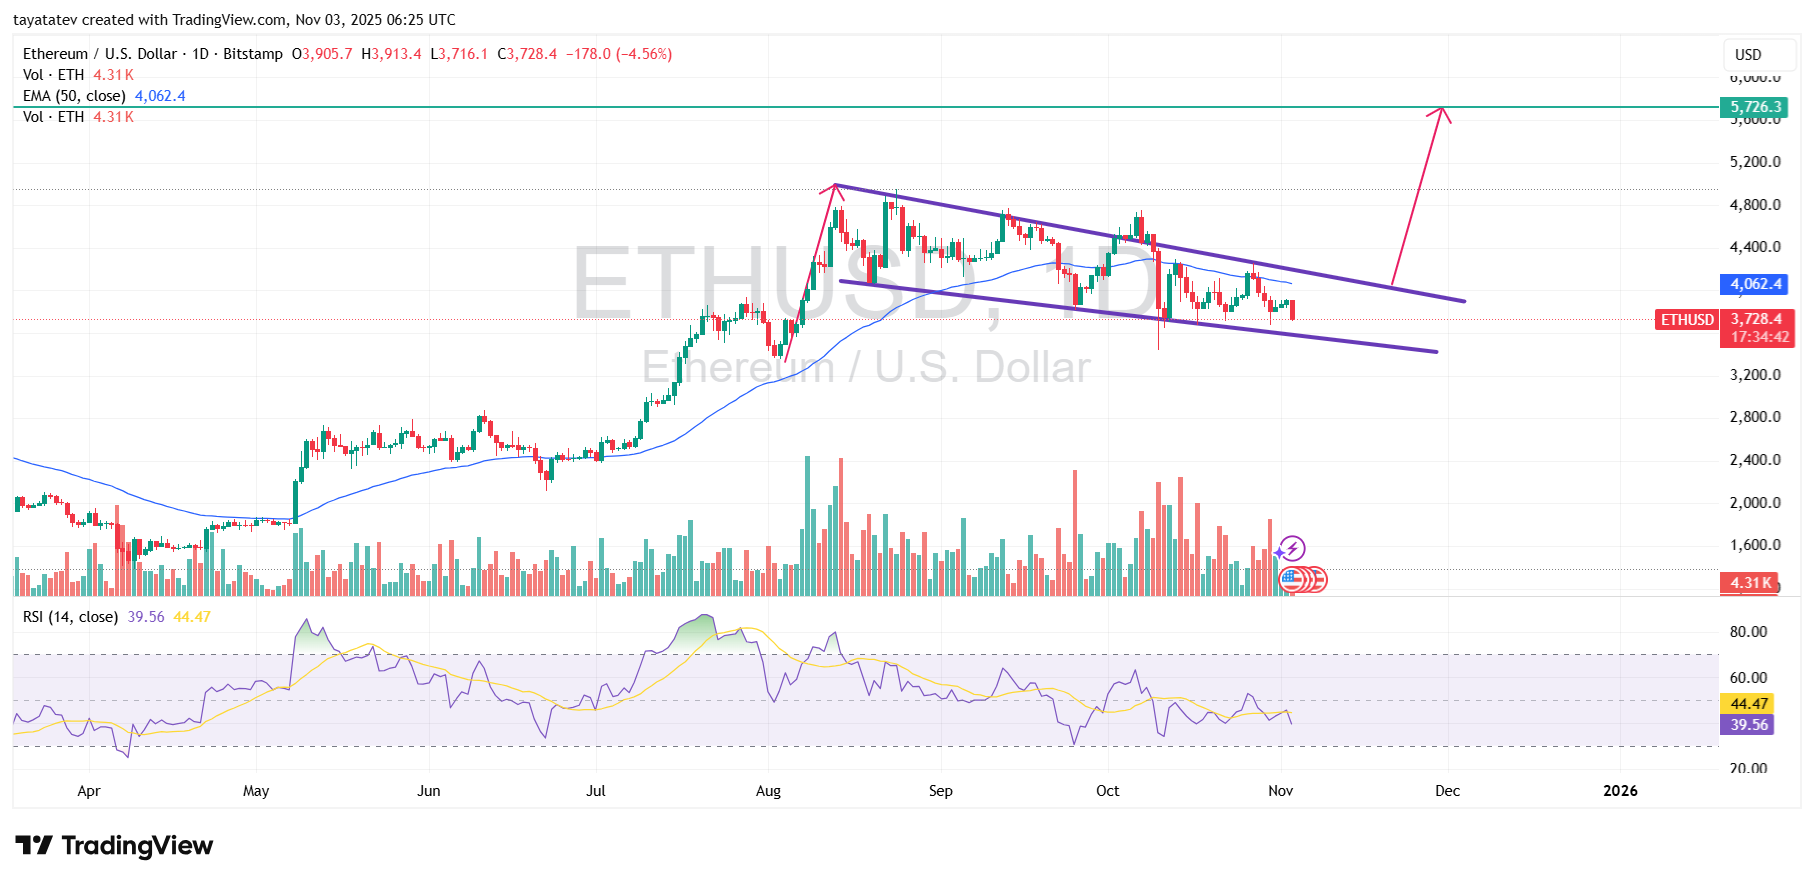
Price still moves inside the wedge, so no confirmation yet. A daily close through the upper boundary near $3,950–$4,050—and ideally above the 50-day EMA—would confirm a breakout.
If that signal prints, the pattern projects about a 53% advance from the current price, implying a target near $5,704. The green reference level around $5,726 on the chart aligns with that objective.
Until then, traders watch support along the lower wedge trendline in the low-$3,600s to mid-$3,500s.
A decisive loss of that line would invalidate the setup and shift focus to deeper support.
However, as long as price holds the lower boundary and momentum stabilizes, the wedge keeps the upside scenario in play pending confirmation.
Disclosure:This article does not contain investment advice or recommendations. Every investment and trading move involves risk, and readers should conduct their own research when making a decision.
Kriptoworld.com accepts no liability for any errors in the articles or for any financial loss resulting from incorrect information.

Tatevik Avetisyan is an editor at Kriptoworld who covers emerging crypto trends, blockchain innovation, and altcoin developments. She is passionate about breaking down complex stories for a global audience and making digital finance more accessible.
📅 Published: November 3, 2025 • 🕓 Last updated: November 3, 2025
