


A single wallet accumulated 393,000 ETH in seven days, spending about $1.38 billion, on-chain data from Cas Abbé shows.
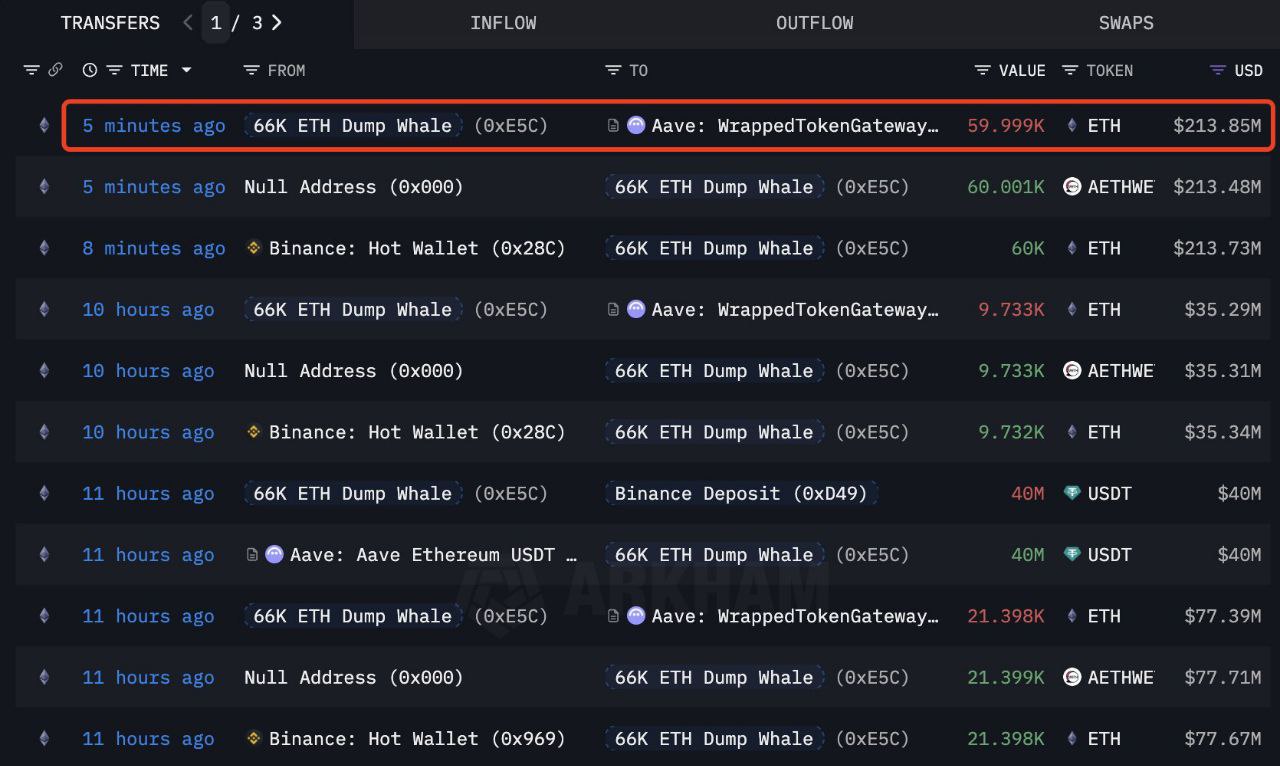
Transfers clustered within the last 24 hours and minutes apart, signaling staged execution rather than a block trade.
Flows passed through Aave’s WrappedTokenGateway and major exchange hot wallets, with periodic ~$40 million USDT funding before each ETH leg.
The buyer’s identity is unknown, but the pattern indicates systematic accumulation.
Ethereum weekly chart stirs debate on $10,000 target
Analyst Ali shared an Ethereum chart on X questioning whether ETH could reach $10,000 by December.
The weekly chart from TradingView shows ETH struggling below $3,600 after a failed attempt to sustain highs near $4,000.
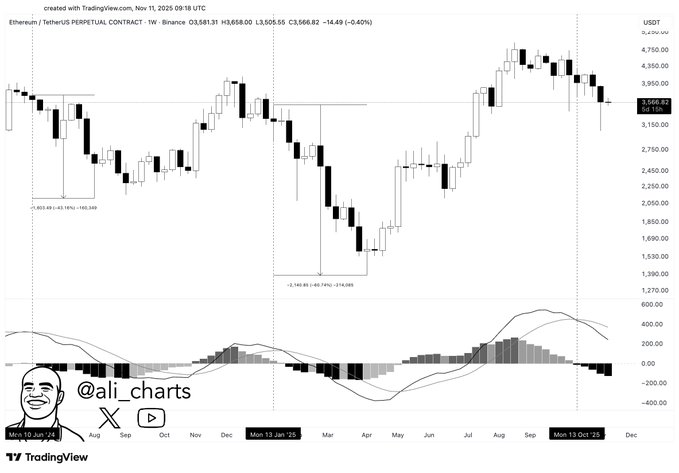
The setup highlights weakening momentum, with the MACD histogram turning negative and both signal lines curving downward.
This trend indicates fading bullish strength as price trades near mid-range support zones.
While the previous rally pushed ETH up from around $2,200 earlier this year, the current candles suggest consolidation rather than continuation.
Traders are watching whether ETH can hold above $3,100 to avoid deeper corrections before any potential rebound.
Ethereum 4h chart forms bearish flag; 18% downside risk — Nov. 12, 2025
Ethereum’s 4-hour ETHUSD chart on Bitstamp shows a bearish flag forming after a sharp early-November drop.
A bearish flag is a brief, rising channel that develops after a steep decline and often precedes another leg lower once price breaks the lower boundary.
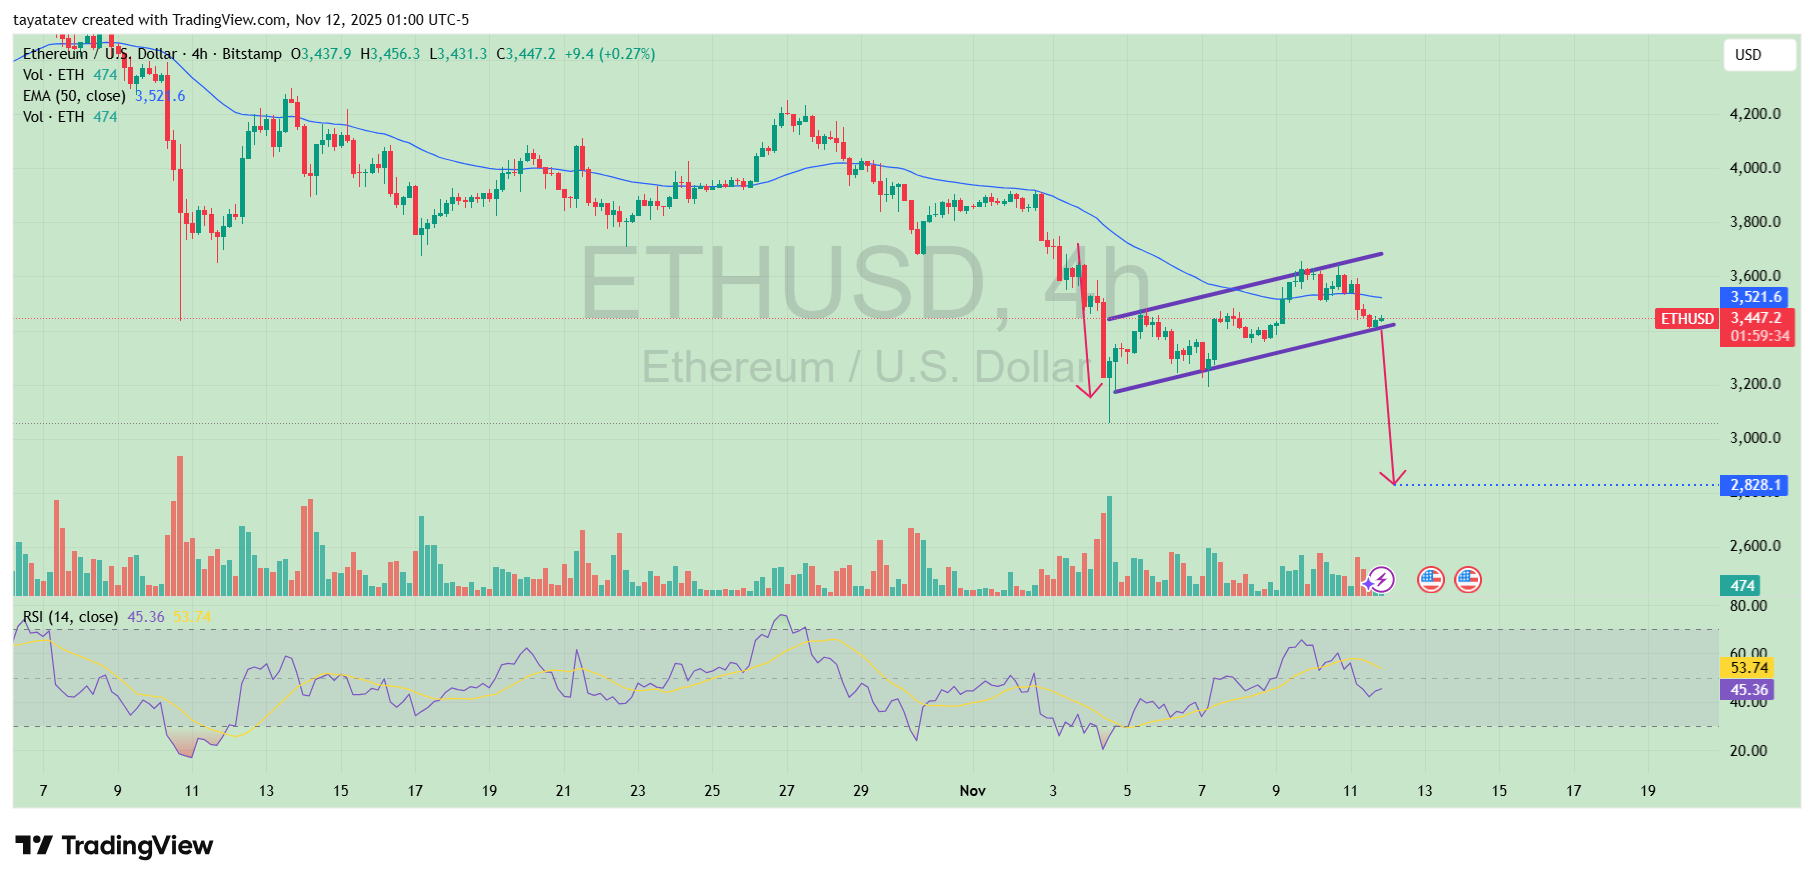
Price trades near $3,447 while hugging the flag’s lower trendline and below the 50-EMA around $3,522.
Volume eased during the flag’s advance, and RSI sits in the mid-40s to low-50s, signaling fading momentum. Therefore, sellers hold the near-term advantage as the pattern matures.
If ETH loses the lower flag line with strong volume, the measured move implies about an 18% decline from the current price—pointing toward roughly $2,827.
Confirmation would come from a decisive close beneath the channel and follow-through selling; otherwise, a swift recovery back above the 50-EMA would weaken the setup.
Disclosure:This article does not contain investment advice or recommendations. Every investment and trading move involves risk, and readers should conduct their own research when making a decision.
Kriptoworld.com accepts no liability for any errors in the articles or for any financial loss resulting from incorrect information.

Tatevik Avetisyan is an editor at Kriptoworld who covers emerging crypto trends, blockchain innovation, and altcoin developments. She is passionate about breaking down complex stories for a global audience and making digital finance more accessible.
📅 Published: November 12, 2025 • 🕓 Last updated: November 12, 2025
