

 setup turns to falling wedge after liquidity sweep, target near $0.192")
Dogecoin flashed mixed technical signals as an inverse head-and-shoulders breakout met swift rejection at a $0.1837–$0.1839 liquidity wall.
Price now compresses in a falling wedge on the 1-hour chart, with a confirmed breakout eyed toward ~$0.192 if buyers reclaim momentum.
Stay ahead in the crypto world – follow us on X for the latest updates, insights, and trends!🚀
Dogecoin breaks neckline as inverse head and shoulders confirms
Dogecoin’s chart shows a confirmed inverse head and shoulders pattern after breaking above its neckline resistance.
The setup, shared by analyst James Easton, marks a potential shift from bearish to bullish momentum.
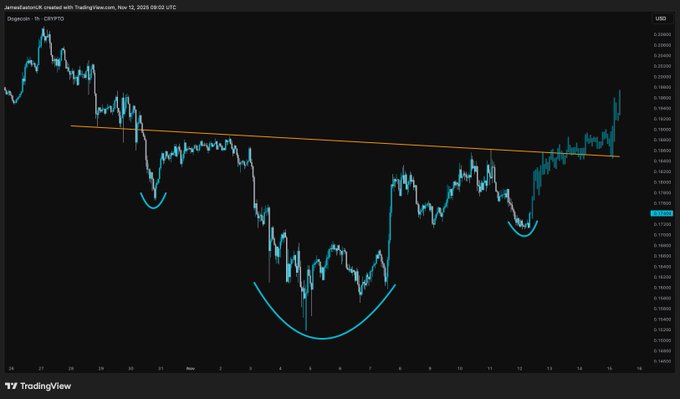
The pattern formed over several weeks, with three clear troughs — the middle one deeper than the others — indicating a gradual accumulation phase.
The neckline resistance, drawn from previous lower highs, acted as a barrier until buyers finally pushed price through with increased volume.
This breakout signals renewed risk appetite in the market. Historically, inverse head and shoulders structures hint at possible trend reversals, suggesting that Dogecoin may extend its recovery if the breakout holds above the neckline.
Short-term traders now monitor whether the price can sustain above this level to confirm bullish continuation.
Dogecoin drops after liquidity sweep near $0.1839
Dogecoin’s recent pullback followed a sharp rejection from the $0.1837–$0.1839 range, where more than $10 million in liquidity had accumulated, according to data from Coinglass shared by Trader Tardigrade.
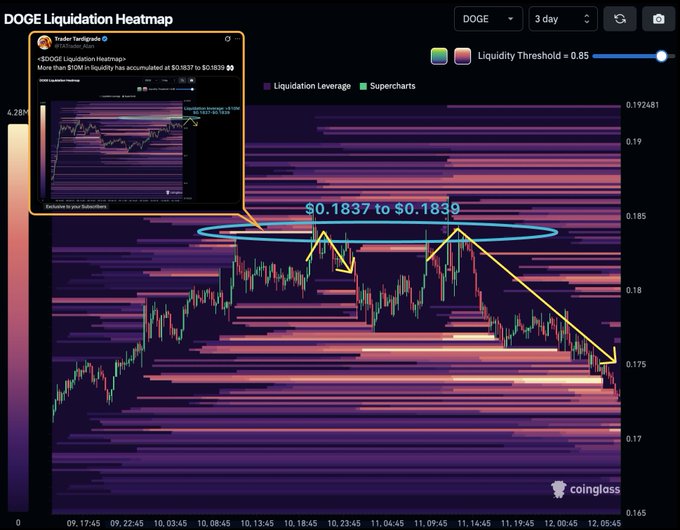
The heatmap shows that these price levels attracted heavy liquidation clusters, creating a high-liquidity zone that acted as resistance.
When DOGE briefly swept this zone, it triggered long liquidations and a fast reversal as sell pressure intensified.
The move aligns with technical patterns seen across short timeframes, where price action formed a descending structure following the rejection.
Traders monitoring the heatmap noted that those aware of the liquidity buildup had time to position short before the decline.
Dogecoin carves a falling wedge; breakout would target ~$0.192
Dogecoin’s 1-hour chart shows a falling wedge from the ~$0.1868 swing high to the ~$0.1714 base, while price rebounds off support near $0.171–$0.172.
A falling wedge is a bullish pattern where lower highs and lower lows compress inside two down-sloping lines, often preceding an upside break.
The 50-EMA sits around $0.1757; reclaiming and holding above it would strengthen the bounce.
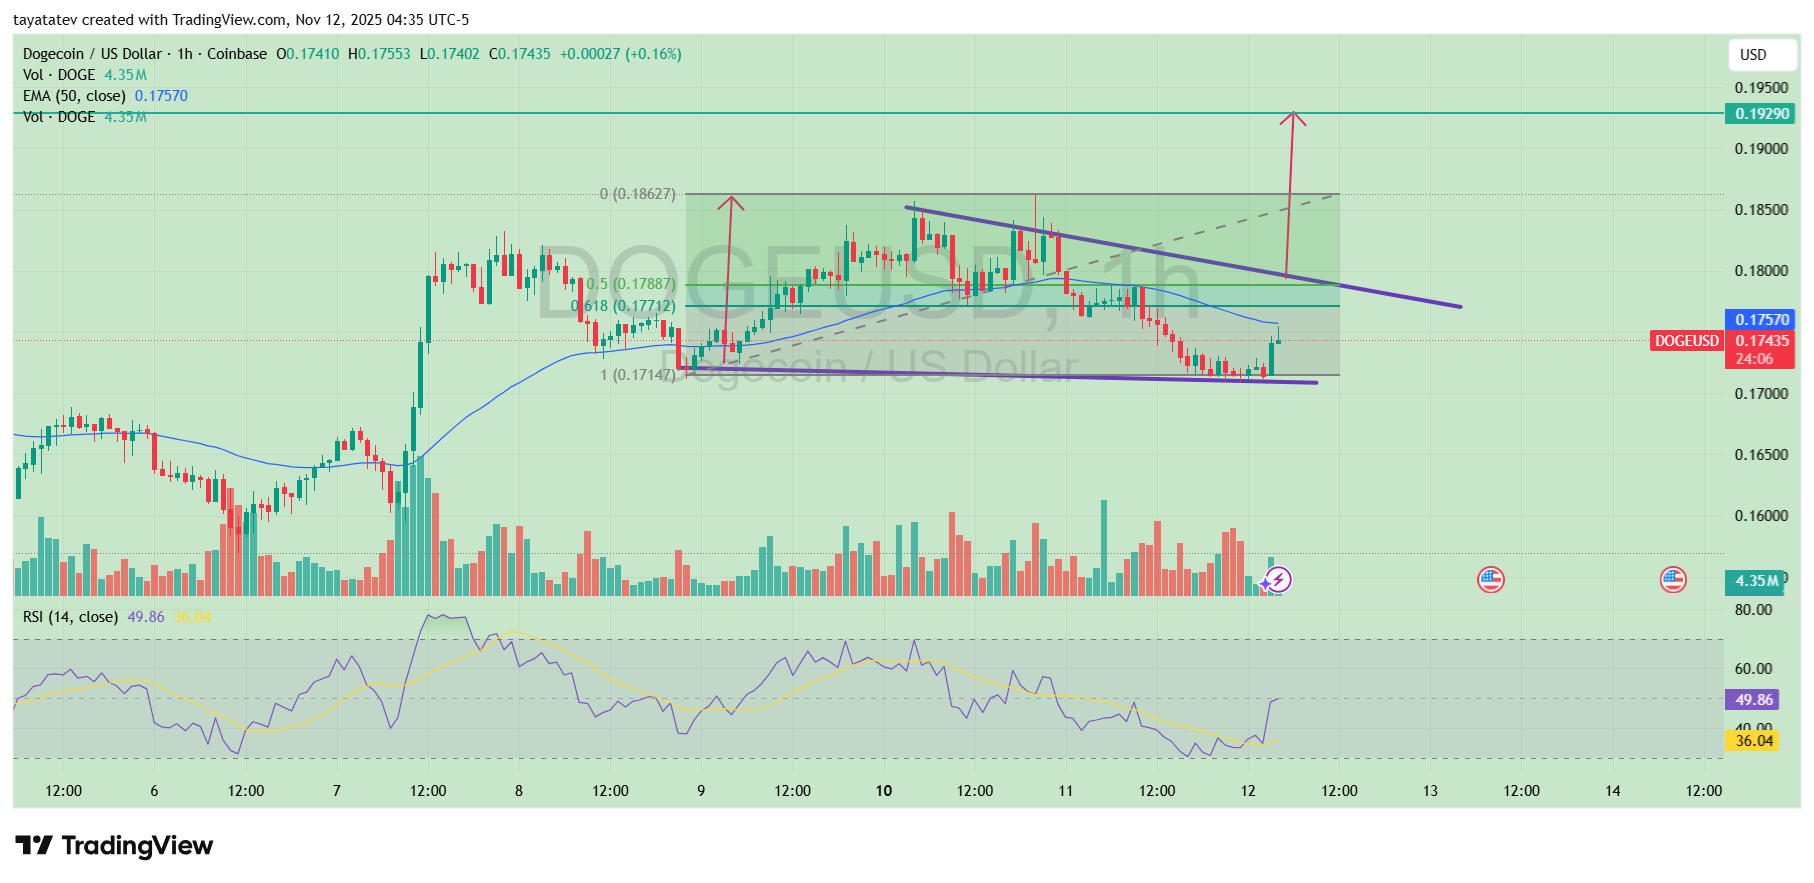
The retracement dipped into the Fibonacci “golden pocket,” with the 0.618 level near ~$0.1771 and the 0.5 near ~$0.1789, indicating typical pullback depth before trend continuation.
Momentum improves as RSI turns up from the mid-30s toward the neutral 50 area, signaling fading sell pressure.
For confirmation, traders watch a clean 1-hour close above the wedge top around $0.179–$0.180 with rising volume.
If confirmed, the measured move from wedge height (~$0.015) implies an objective toward ~$0.195, while a conservative 10% advance from the current ~$0.174 would project to about $0.1918, aligning with the next marked resistance near $0.1929.
Conversely, a loss of $0.171–$0.172 would invalidate the setup and expose $0.168.
Disclosure:This article does not contain investment advice or recommendations. Every investment and trading move involves risk, and readers should conduct their own research when making a decision.
Kriptoworld.com accepts no liability for any errors in the articles or for any financial loss resulting from incorrect information.

Tatevik Avetisyan is an editor at Kriptoworld who covers emerging crypto trends, blockchain innovation, and altcoin developments. She is passionate about breaking down complex stories for a global audience and making digital finance more accessible.
📅 Published: November 12, 2025 • 🕓 Last updated: November 12, 2025
