


On Dec. 1, 2025, the AVAX/USDT daily chart showed Avalanche trading near $13 with a clear bearish flag pattern that warns of much deeper downside.
A bearish flag is a continuation pattern where a sharp sell-off creates a “flagpole,” then price grinds lower inside a tight, downward-sloping channel before often breaking down for another leg in the same direction.
Stay ahead in the crypto world – follow us on X for the latest updates, insights, and trends!🚀
If AVAX confirms this pattern with a decisive break below the lower boundary of the channel, the measured move points to a drop of roughly 80 percent from the current level toward about $2.60 per token.
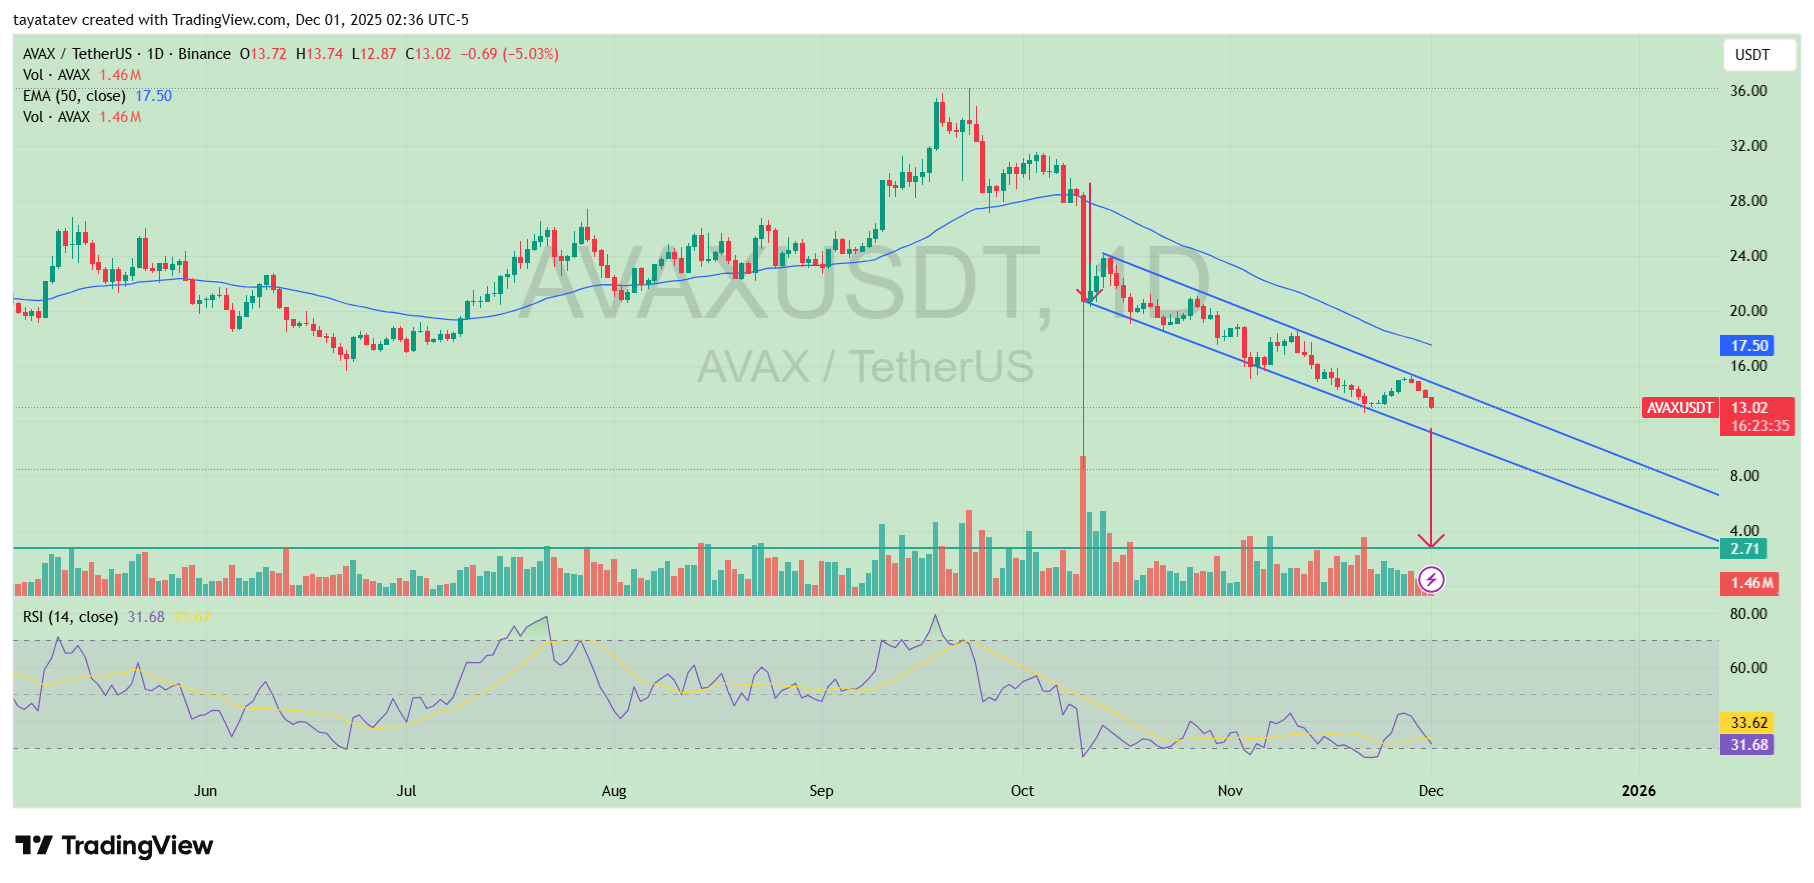
The chart highlights a vertical red “flagpole” candle from early October, when heavy selling drove AVAX sharply lower on high volume.
Since that shock move, price has stayed trapped inside a falling parallel channel, making lower highs and lower lows while volume gradually fades.
Now, AVAX trades beneath the midline of that channel, suggesting sellers still control the structure even when short bounces appear.
At the same time, the 50-day exponential moving average near $17.50 slopes downward above price and acts as dynamic resistance.
Each attempt to recover toward that line has failed, and the latest rejection leaves AVAX pressing back toward the lower boundary of the flag.
As long as the token remains below this declining 50-day EMA and inside the channel, the dominant trend points lower rather than higher.
Momentum signals echo that pressure. The 14-day relative strength index sits around 32, close to the oversold region, showing persistent selling strength with only brief relief rallies.
RSI can stay weak for extended periods in strong downtrends, so oversold readings alone do not negate the bearish continuation setup.
Instead, they underline how the market has rewarded sellers since the October breakdown.
If price closes convincingly below the channel floor, the technical target takes the length of the flagpole and projects it downward from the breakout point.
That calculation implies an extension of the prior drop and places the potential destination near $2.60, close to the long-term support band visible around the $2.70 area on the chart.
Until AVAX can reclaim the falling channel and the 50-day EMA, the pattern signals that downside risk remains significant, even if brief counter-trend rallies occur along the way.
This is a description of the chart setup, not a guarantee of future performance or a recommendation to trade.
AVAX Retest Raises Risk Of Drop Toward $9
Avalanche’s AVAX token is retesting a key breakout zone that once acted as strong support, raising the risk of another leg lower toward $9. In a recent post on X, analyst Ali said AVAX has returned to the $16.25 area after breaking below it, framing the move as a classic pause before a possible continuation of the downtrend.
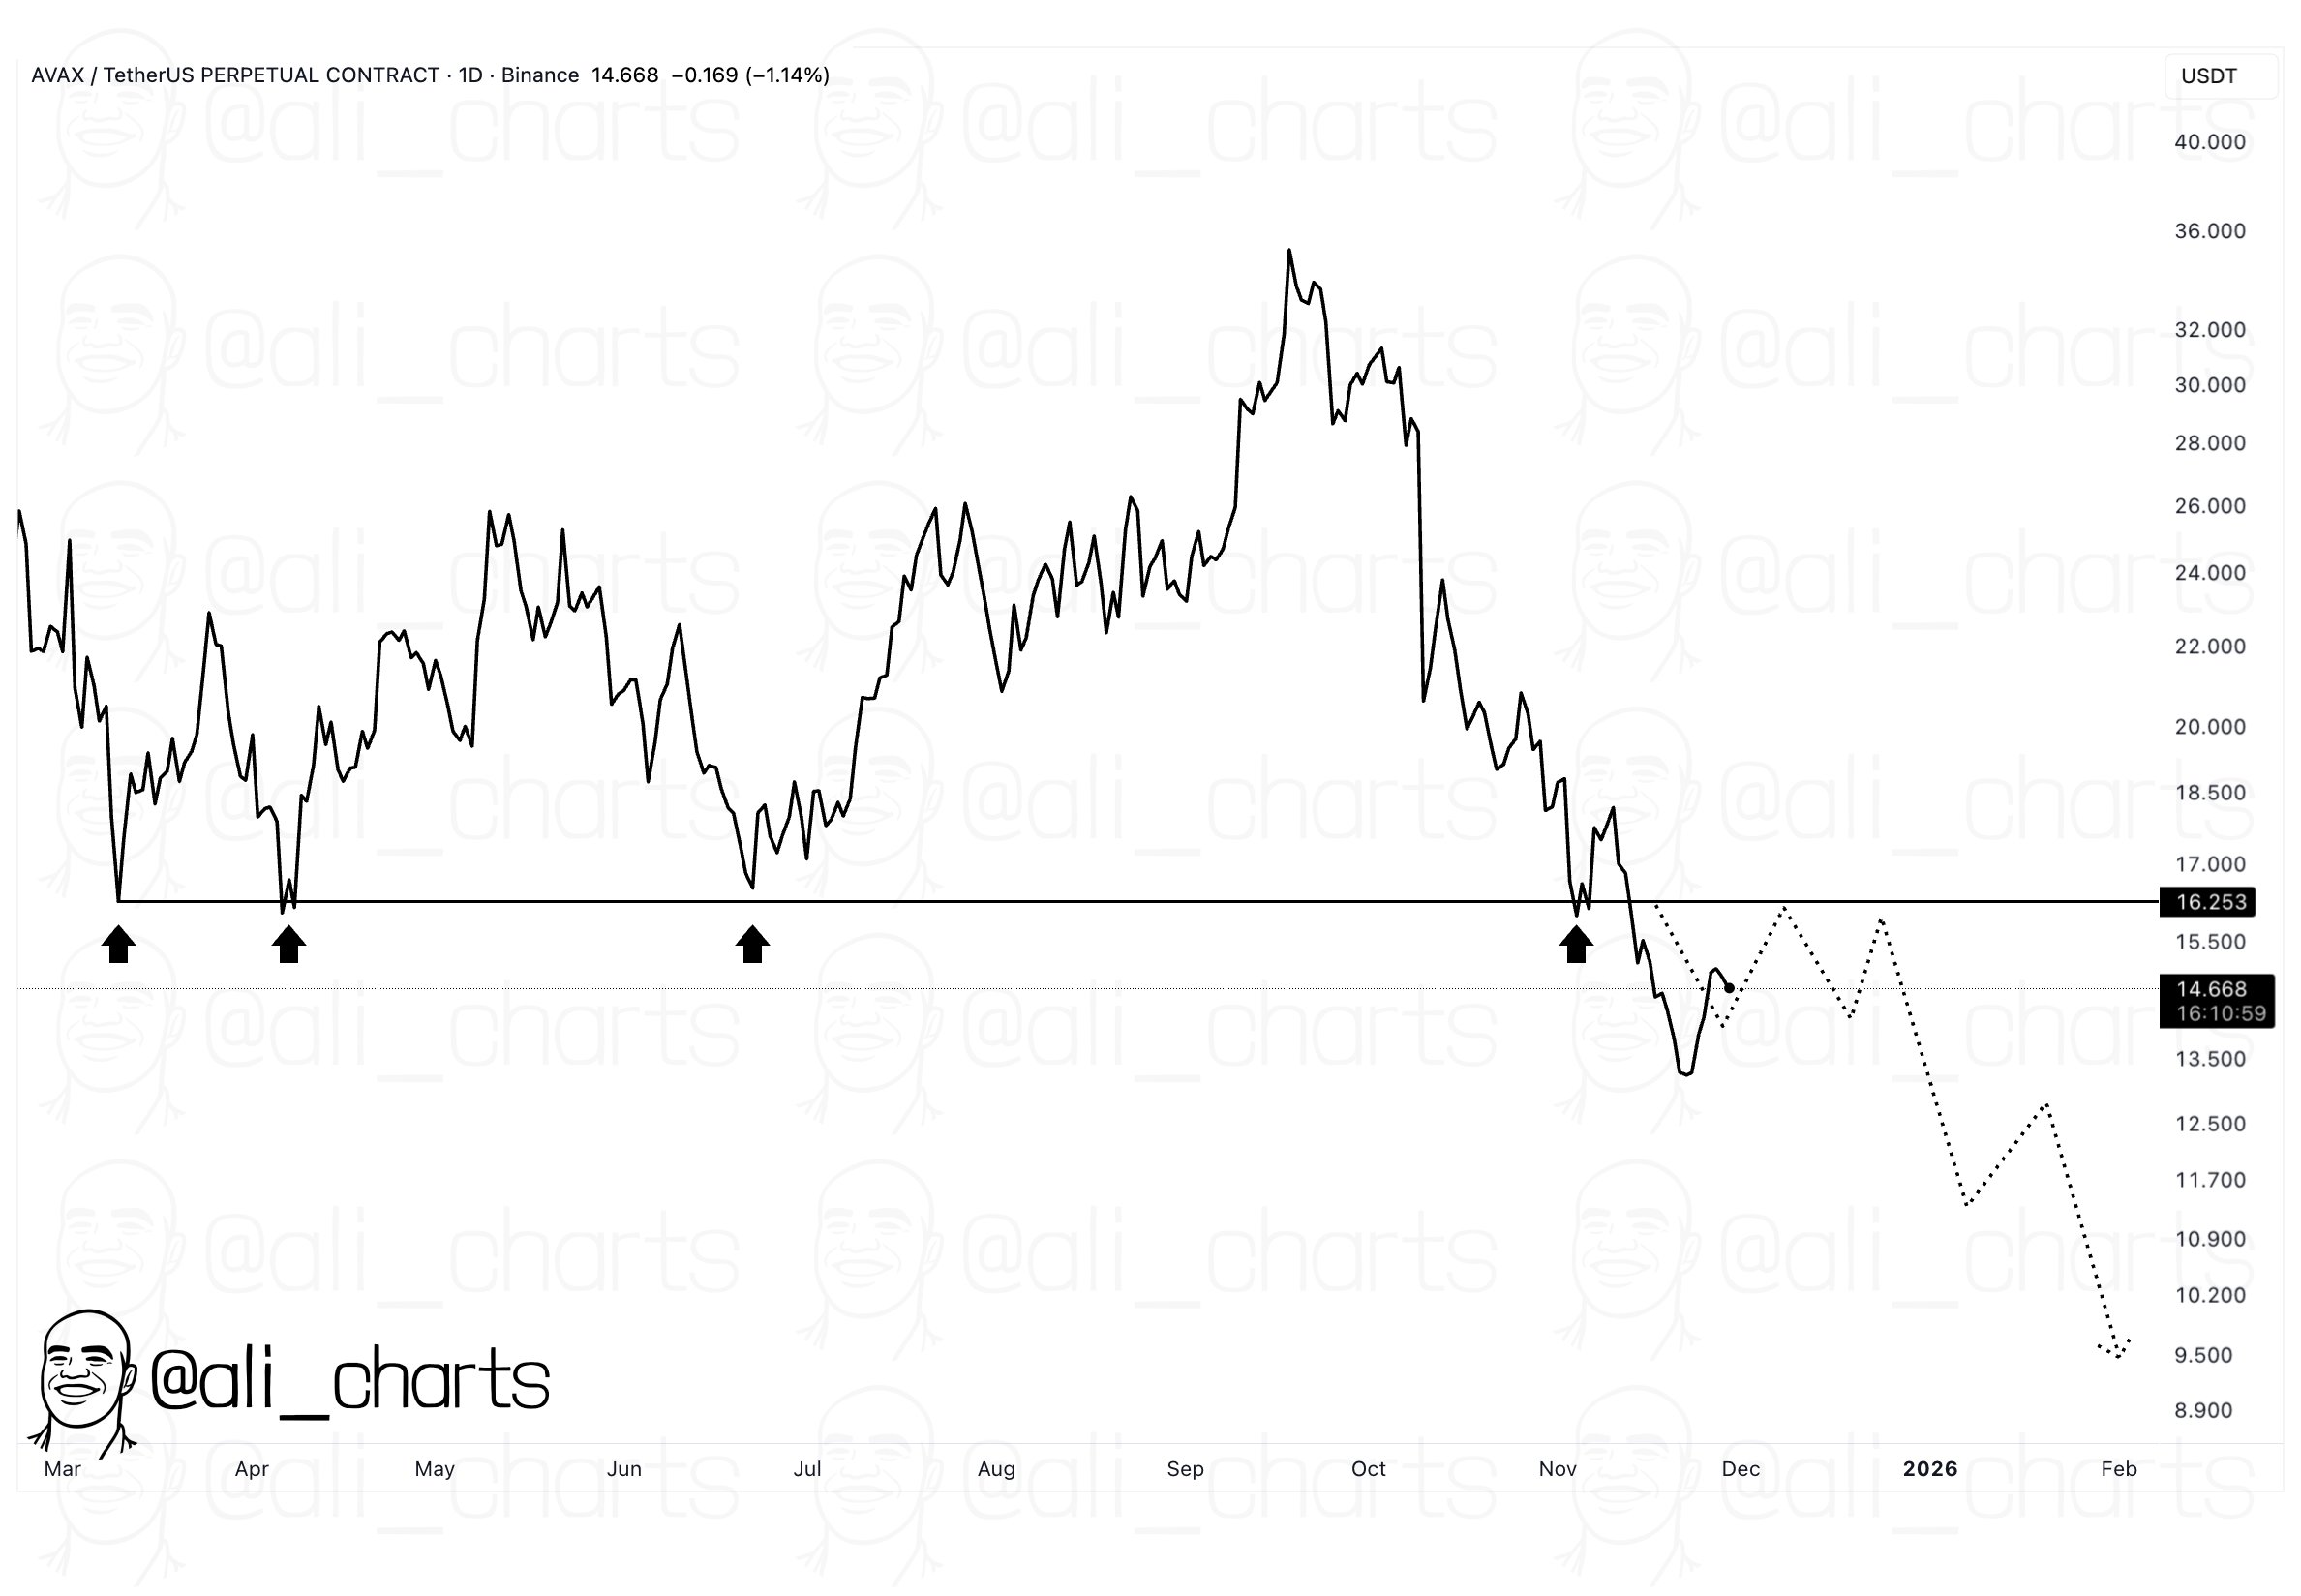
The chart plots AVAX’s earlier bounces from roughly the same horizontal band between March and August, when buyers repeatedly defended the level.
After October’s steep sell-off, price sliced through that floor and turned it into resistance. Now, with AVAX trading in the mid-$14 range, the market is leaning back into that former support from below, effectively testing whether sellers still dominate there.
In technical terms, a “retest of the breakout zone” happens when price revisits a level it has already broken, checking if the old support has flipped into a ceiling.
If AVAX fails to close back above the $16–$17 region and instead turns down again, that rejection would confirm the level as resistance and validate the continuation setup.
Ali’s projected path on the chart outlines a series of lower highs and lower lows that could push AVAX toward the $9 area, implying more than 35 percent downside from current prices.
The scenario remains conditional on how AVAX behaves around this band.
A firm move above and sustained trade over the breakout zone would weaken the bearish case, while a clear rejection would strengthen it and keep the focus on the $9 support cluster as the next major target.
These projections reflect chart-based probabilities rather than certainties about future performance.
Disclosure:This article does not contain investment advice or recommendations. Every investment and trading move involves risk, and readers should conduct their own research when making a decision.
Kriptoworld.com accepts no liability for any errors in the articles or for any financial loss resulting from incorrect information.

Tatevik Avetisyan is an editor at Kriptoworld who covers emerging crypto trends, blockchain innovation, and altcoin developments. She is passionate about breaking down complex stories for a global audience and making digital finance more accessible.
📅 Published: December 1, 2025 • 🕓 Last updated: December 1, 2025
