


Shiba Inu shows a clear bearish flag on the daily chart, and the structure now guides the current downside scenario.
A bearish flag appears when price falls sharply, then trades inside a narrow, upward-tilted or sideways channel before breaking lower again.
Stay ahead in the crypto world – follow us on X for the latest updates, insights, and trends!🚀
The pattern signals continuation because the consolidation does not erase prior selling pressure.
Instead, sellers stay in control while price oscillates between two converging lines, waiting for momentum to resume in the original direction.
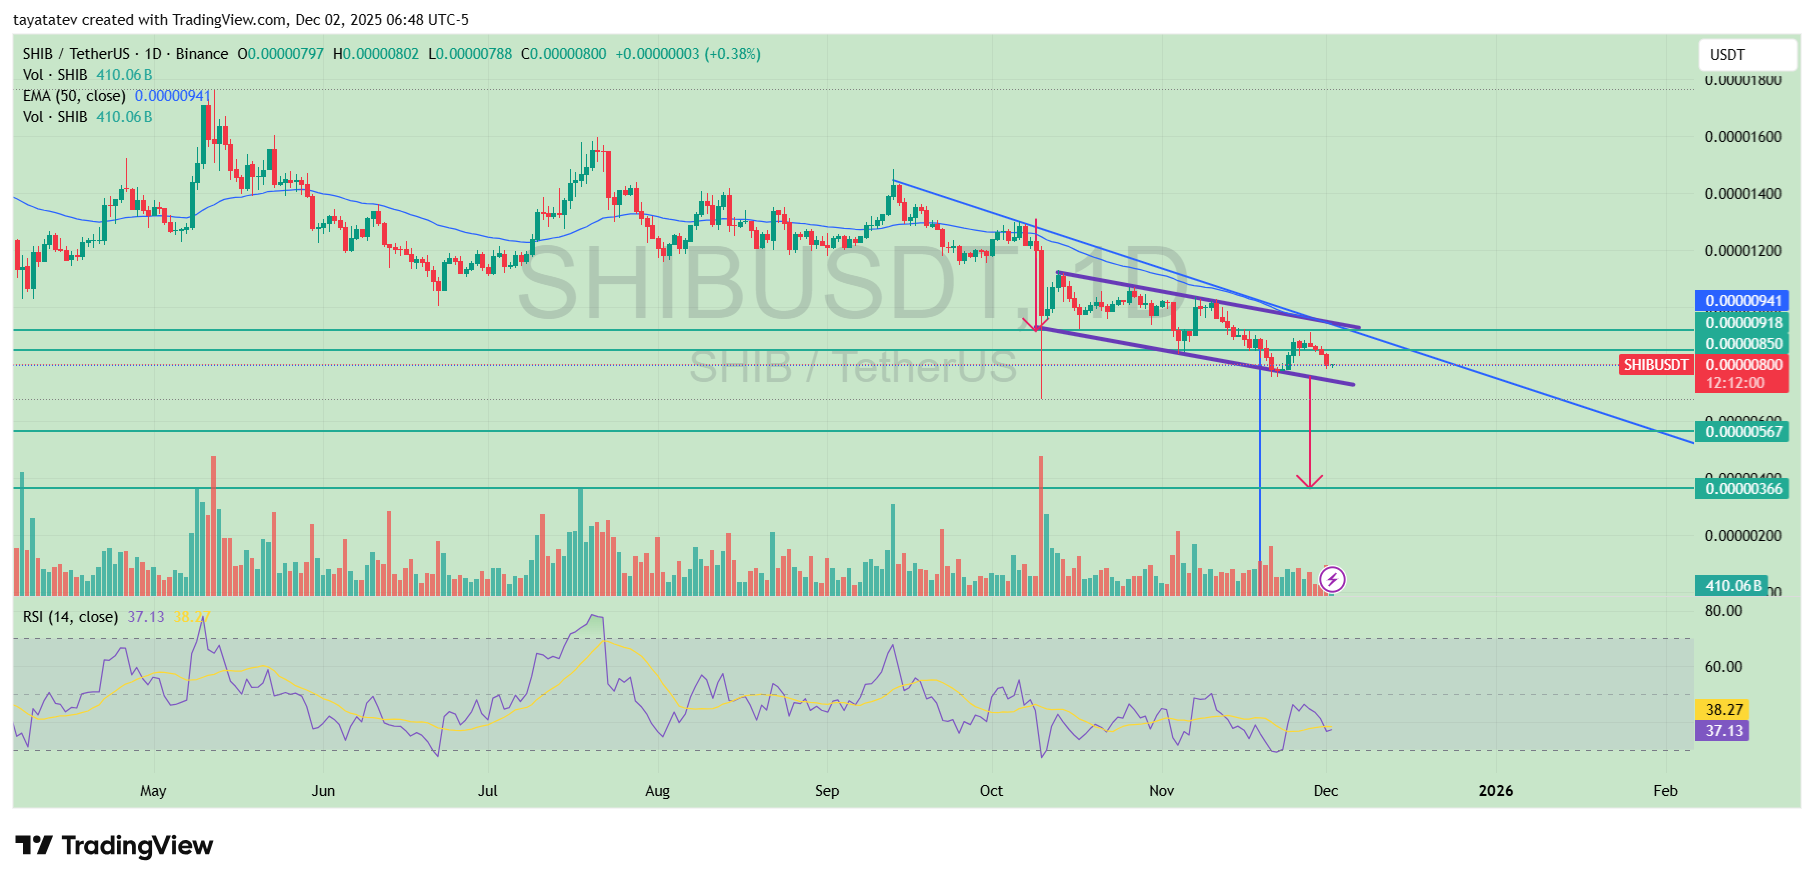
SHIB’s flag formed after the sharp September drop that established the flagpole. Price then moved inside the downward-sloping channel marked by the two trendlines. Each bounce stalled near the upper boundary.
Meanwhile, the lower boundary held until late November, when SHIB lost support and slipped under the channel.
This move confirmed the bearish flag and activated the measured-move target, which extends the flagpole from the breakdown point.
Because the flagpole length measures roughly 55 percent of SHIB’s value, the pattern points toward another decline of similar magnitude.
From the current region near $0.00000800, the projected target sits around $0.00000360.
The chart shows this zone with a horizontal support band that aligns with price action from early summer.
The breakdown arrow on the image also signals that sellers may drive the token toward that level if momentum persists.
SHIB weakened below the 50-day EMA as well, and this moving average now tilts lower, reinforcing bearish structure. Moreover, the RSI drifts near the mid-30s with no bullish divergence, which suggests that downside pressure remains intact.
As SHIB trades below both the trendline resistance and the flag’s lower boundary, the validation of the bearish flag stands.
Until the token reclaims the upper channel boundary and breaks the descending trendline decisively, the pattern’s 55 percent target toward $0.00000360 stays in play.
Analyst Maps Shiba Inu Support at $0.00000680 as Downtrend Deepens
Shiba Inu keeps sliding after a year of steady losses, with the token now down about 62% from earlier levels.
In a new TradingView update, analyst EhsanZeydabadi notes that SHIB already broke below several supports and now trades around $0.0000079.
He marks the next major downside level near $0.00000680, arguing that the bearish trend could extend toward that zone if selling pressure continues.
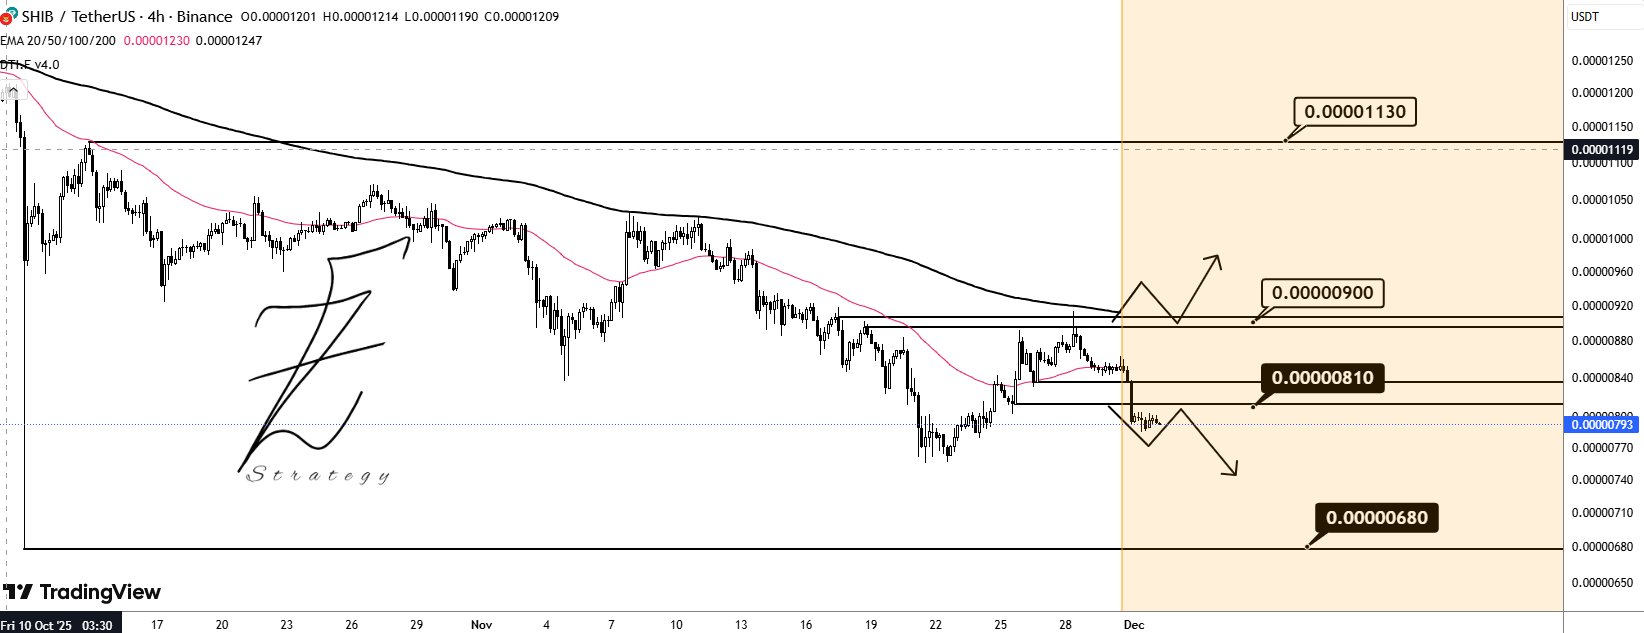
At the same time, the chart still shows paths for a short-term recovery. The analyst highlights the $0.00000810 area as an important demand zone.
If SHIB quickly reclaims and holds above that band, it could stage a bounce toward $0.0000090, which would act as confirmation that buyers are stepping back in.
From there, follow-through strength might even lift price toward the higher resistance cluster close to $0.00001130.
However, as long as SHIB stays under $0.00000810, the analysis keeps $0.00000680 as the key support to watch in this downtrend.
Disclosure:This article does not contain investment advice or recommendations. Every investment and trading move involves risk, and readers should conduct their own research when making a decision.
Kriptoworld.com accepts no liability for any errors in the articles or for any financial loss resulting from incorrect information.

Tatevik Avetisyan is an editor at Kriptoworld who covers emerging crypto trends, blockchain innovation, and altcoin developments. She is passionate about breaking down complex stories for a global audience and making digital finance more accessible.
📅 Published: December 2, 2025 • 🕓 Last updated: December 3, 2025
