


Bitcoin trades inside an ascending triangle on the 4-hour chart. An ascending triangle forms when price builds higher lows against a flat resistance, showing buyers pushing upward while a ceiling keeps price capped.
Price moves along the rising purple trendline and now presses against the resistance area near 93,800 to 94,200 dollars.
Stay ahead in the crypto world – follow us on X for the latest updates, insights, and trends!🚀
This zone stopped every rebound since late November. At the same time, the higher lows from Nov. 21, Nov. 25 and Dec. 2 show clear buying pressure.
The structure holds as long as price stays above the rising support near 90,500 dollars.
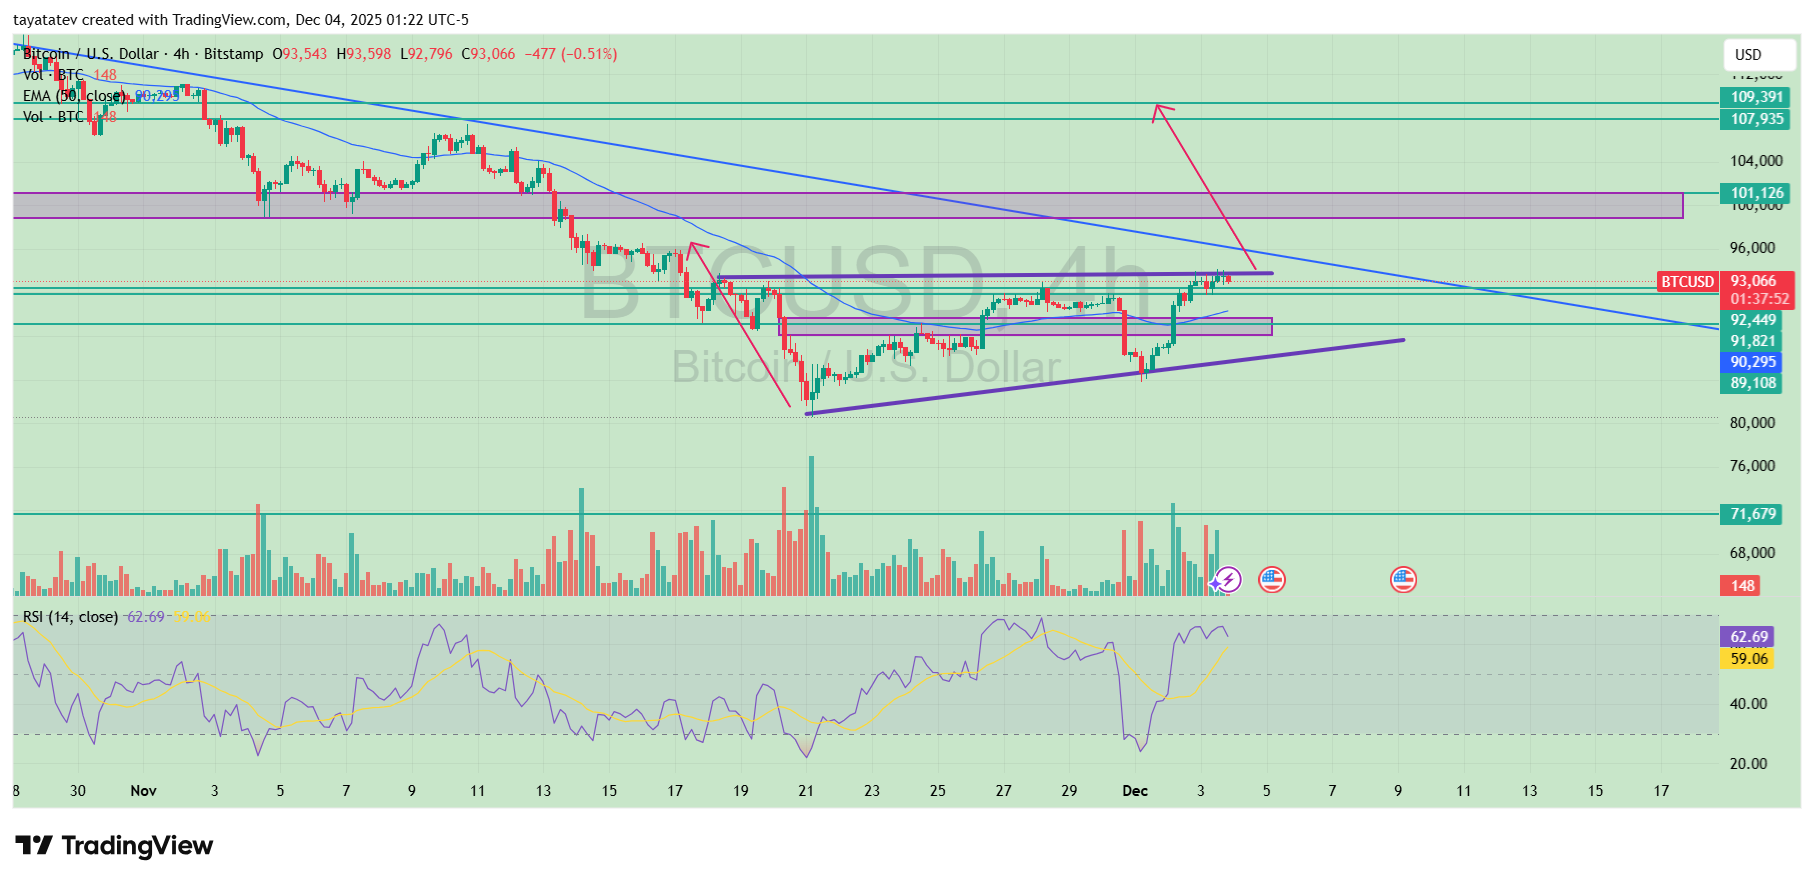
The 50-period EMA sits just above the breakout zone and acts as an extra barrier. Because price trades directly under the EMA, Bitcoin needs a clean 4-hour close above both the EMA and the horizontal resistance to confirm the pattern. Until that happens, upward momentum stays limited.
The RSI at 62 signals mild strength without being overbought. It shows buyers remain active but still need stronger confirmation to break the ceiling.
Meanwhile, volume rises on recent green candles, which supports the bullish structure. A breakout usually needs expanding volume, and the chart begins to show that pressure.
If Bitcoin breaks out, the ascending triangle’s measured move implies about a 17 percent upside from current levels.
This projection points toward the 108,000 to 109,000 dollar area, matching the upper horizontal bands on your chart.
However, Bitcoin still trades under resistance. If price fails to break above the ceiling, it will likely consolidate again between 91,800 and 93,800 dollars.
Only a clear breakout will confirm the pattern and open the path toward the target zone.
Bitcoin Holds Its Trend as Historical Drawdowns Repeat
Bitcoin continues to follow the same drawdown rhythm shown on the chart shared by ColdBloodedShiller.
The visual highlights three major pullbacks since 2023, each dropping between 31 and 36 percent before price resumed its broader uptrend.
The latest decline of about 35 percent places the current move in line with previous cycles, which keeps the larger trend intact.
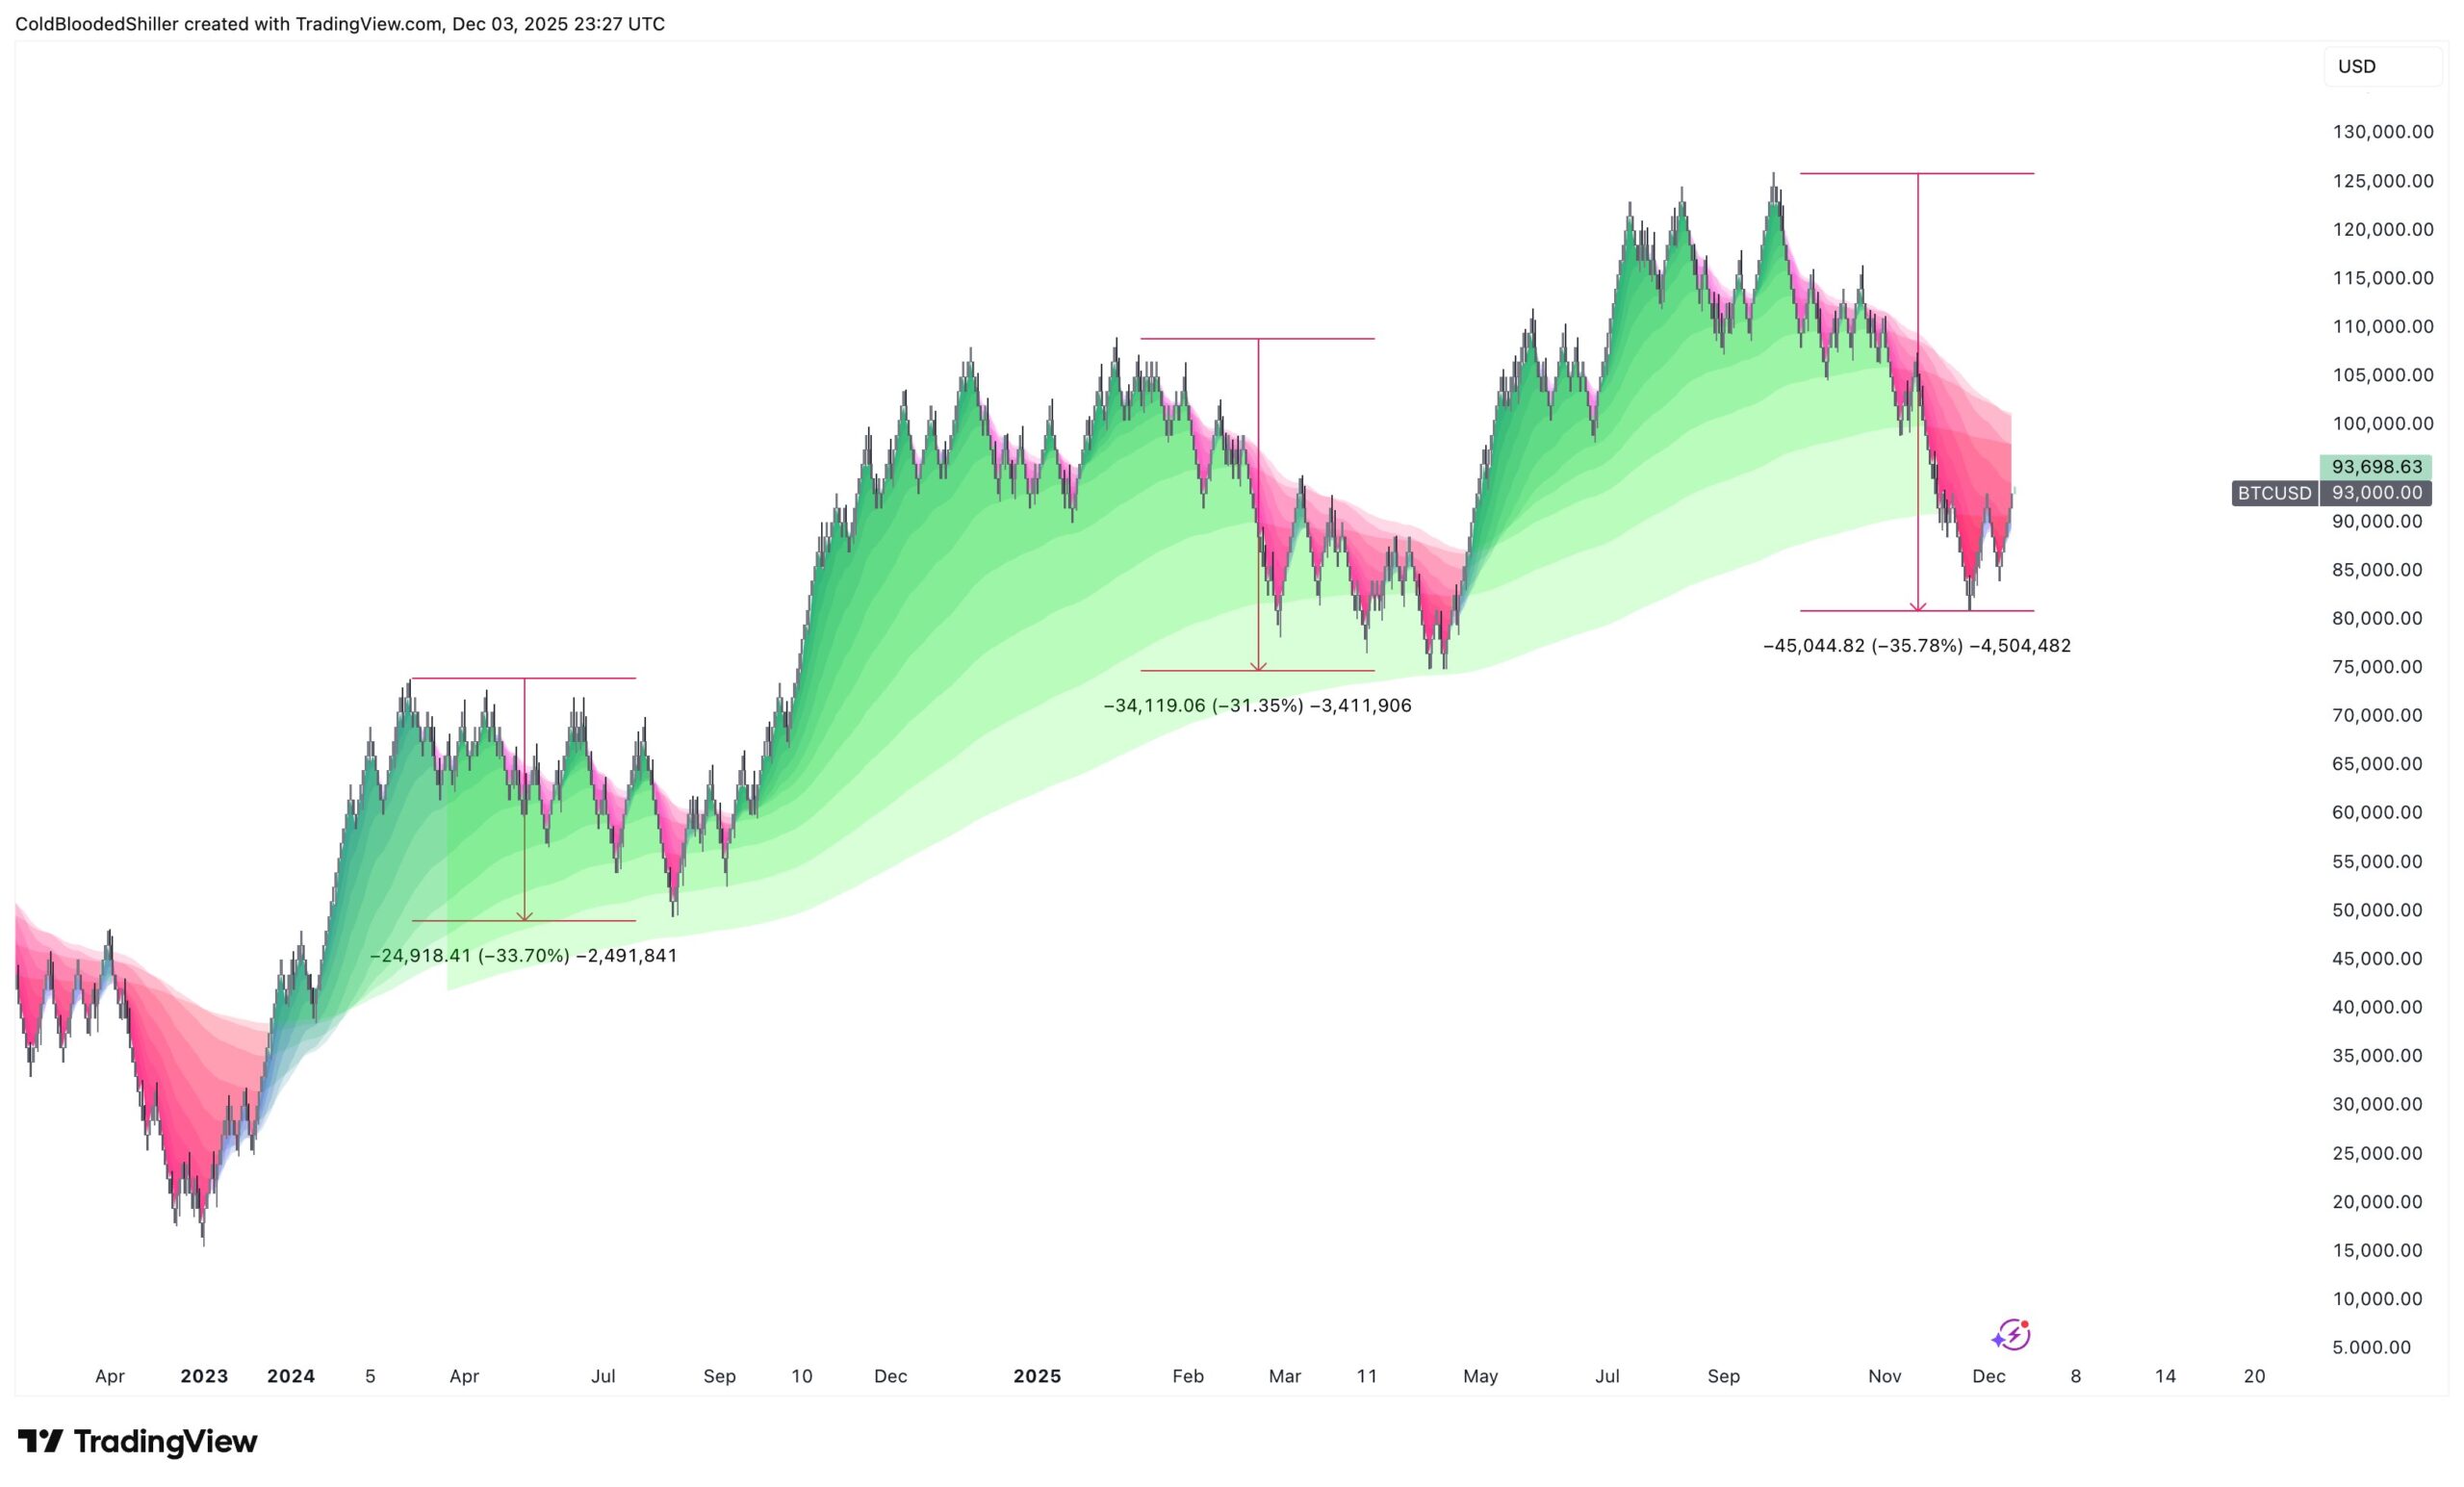
The chart’s green gradient bands show Bitcoin repeatedly correcting into the same support region before recovering.
Each pullback formed a similar structure: a sharp decline, a stabilization phase inside the green zone and then a push toward the next major high.
Because the latest drop mirrors the earlier −33 percent and −31 percent moves, the long-term trend maintains its structure.
Price now trades around the mid-band after the November low. This position shows that Bitcoin has already completed the typical corrective range seen in earlier cycles.
If the trend continues to follow previous patterns, the next phase would be an upward extension similar to the rebounds that followed past drawdowns.
ColdBloodedShiller notes this as the setup heading into a seasonal rally.
The chart presents the expectation for another advance, with some analysts pointing to the possibility of higher levels into early 2026.
While the projection marks 145,000 dollars as a potential future target in March 2026, the key takeaway remains the consistency of Bitcoin’s repeated cycle structure across the past three years.
Disclosure:This article does not contain investment advice or recommendations. Every investment and trading move involves risk, and readers should conduct their own research when making a decision.
Kriptoworld.com accepts no liability for any errors in the articles or for any financial loss resulting from incorrect information.

Tatevik Avetisyan is an editor at Kriptoworld who covers emerging crypto trends, blockchain innovation, and altcoin developments. She is passionate about breaking down complex stories for a global audience and making digital finance more accessible.
📅 Published: December 4, 2025 • 🕓 Last updated: December 4, 2025
