


XRP continues to move inside a confirmed downtrend on the four-hour chart dated Dec. 5, 2025. Price stays under the descending trendline that has rejected every rebound since mid-October.
The 50-EMA also runs above current price action, reinforcing the downward structure.
Stay ahead in the crypto world – follow us on X for the latest updates, insights, and trends!🚀
Each attempt to reclaim the moving average faded quickly, which keeps sellers in control of the broader direction.
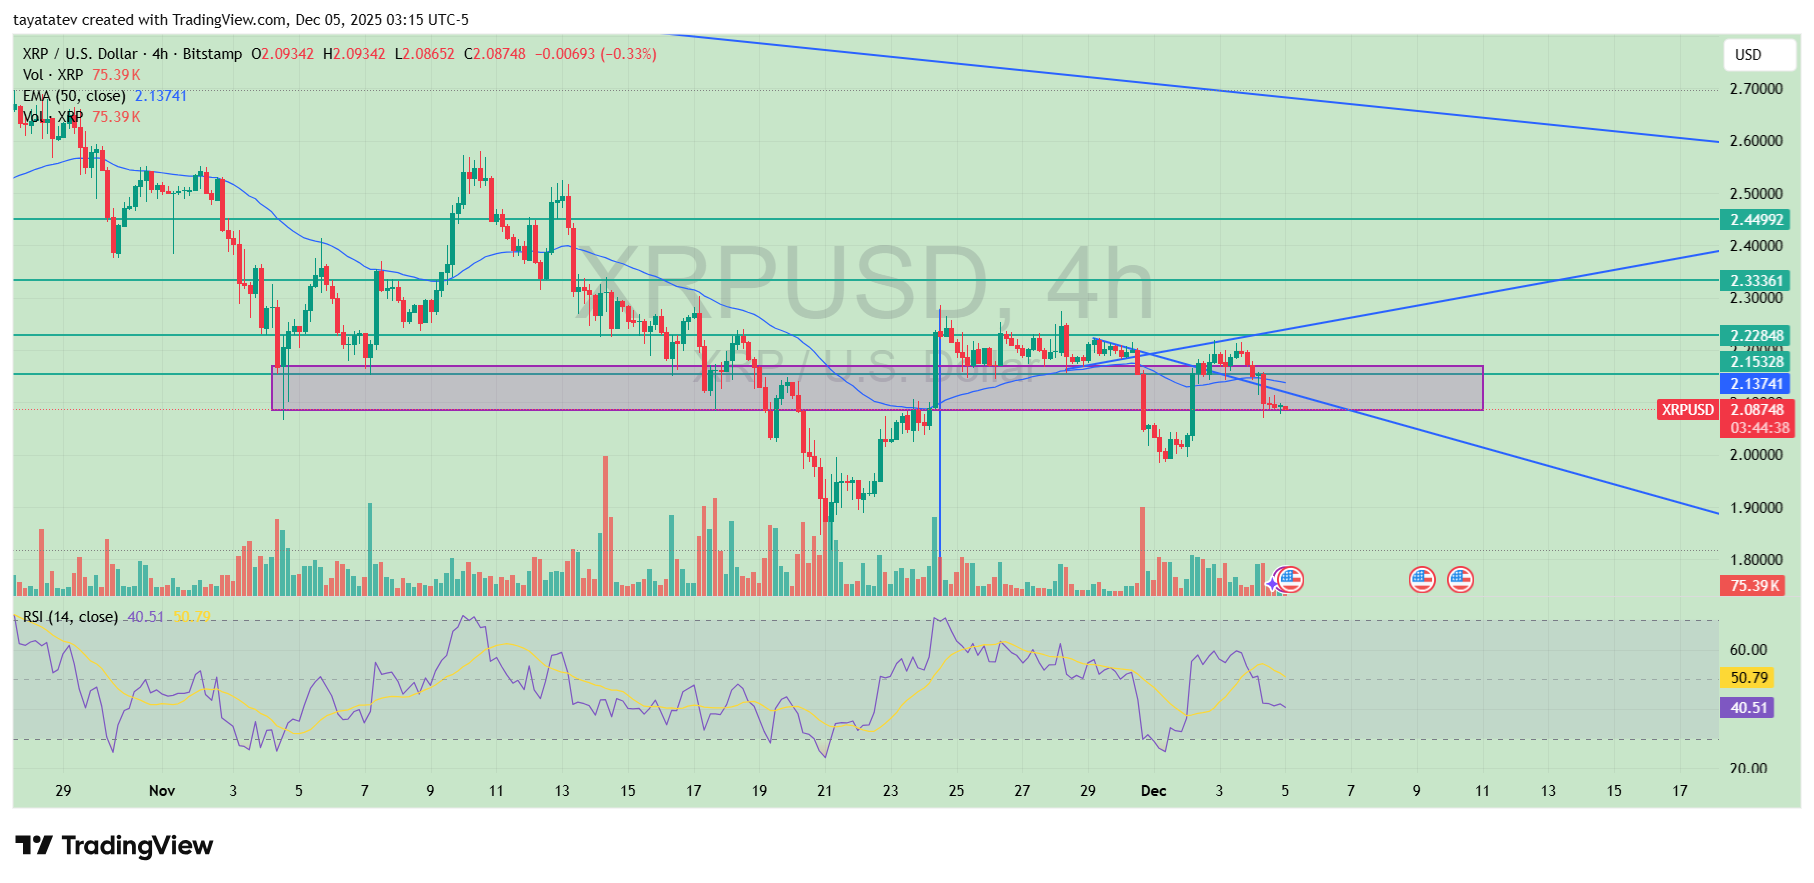
At the same time, XRP now sits directly inside a well-defined support zone between roughly 2.07 and 2.14 dollars.
This area has acted as a demand block several times since late October. Each time price entered this range, buyers stepped in and prevented deeper declines.
Volume also shows brief spikes along this zone, signaling active participation whenever XRP revisits the support band.
However, the trend does not shift unless price breaks above the first resistance cluster near 2.15 dollars. This level aligns with the 50-EMA and the underside of the descending trendline.
Therefore, any sustained close above 2.15 would signal the first structural improvement and open the way toward the next resistance area around 2.28 dollars.
Until that move happens, XRP remains inside the broader downtrend even though it holds support for now.
The RSI at the bottom of the chart sits near mid-40s, which shows neutral momentum without signs of strong strength or panic selling.
The indicator remains below its midline, matching the chart’s bearish structure while still leaving room for a reaction if buyers defend the support zone again.
Overall, XRP trades inside a downtrend but rests at a key support level. A decisive break above 2.15 dollars would be the first sign that the market is attempting a reversal from this zone.
XRP Shows Bullish Divergence as Price Holds a Major Demand Zone
Meanwhile, the daily chart highlights XRP testing a broad demand zone between roughly 2.00 and 2.15 dollars while forming a clear bullish divergence on the RSI.
Price prints a lower low across November, yet the RSI creates a higher low at the same time.
This pattern signals weakening downside momentum even as sellers pushed price slightly lower.
The divergence appears directly above the same support area that has repeatedly absorbed heavy declines throughout the year, which strengthens the zone’s significance.
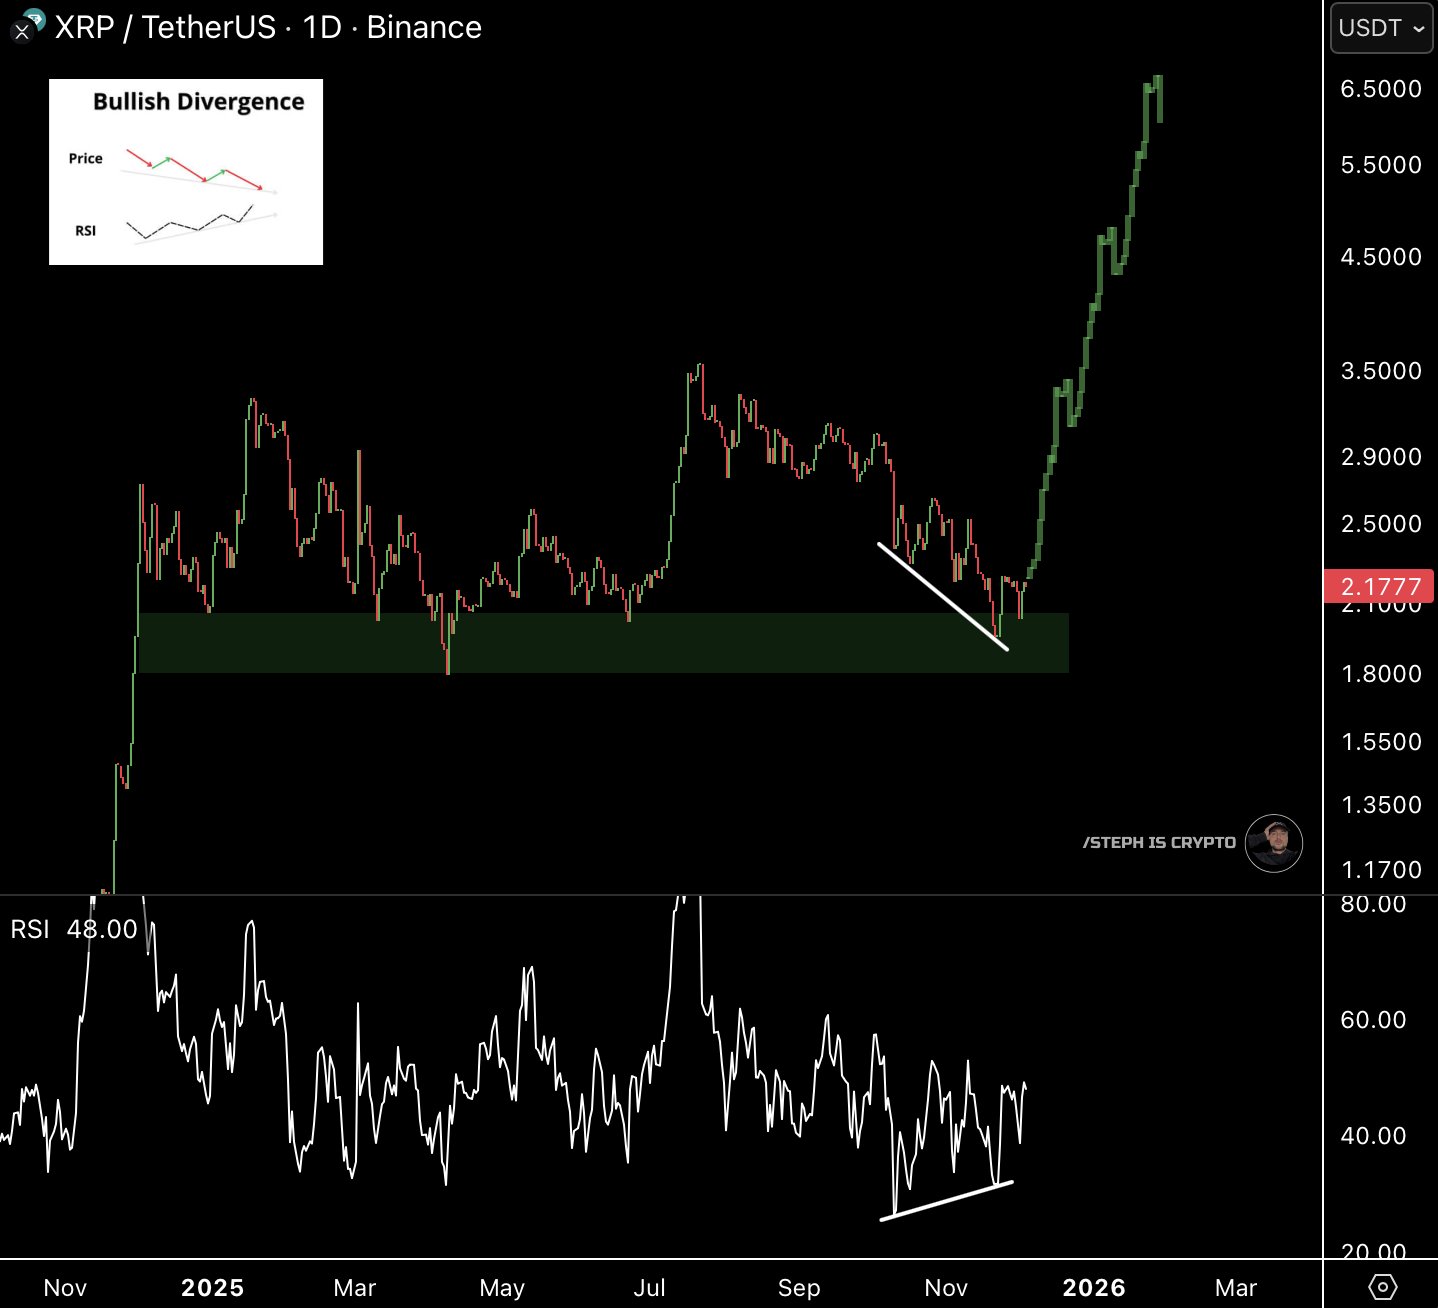
As XRP moves inside this demand block, the reaction shows buyers defending the range again.
The wick structure along the bottom confirms strong absorption, while the divergence marks a shift in momentum beneath the surface.
Because the trend entered a prolonged corrective phase ahead of this signal, the divergence acts as the first structural sign of potential exhaustion in the selloff.
A sustained move back above the mid-2.10 region would confirm that buyers regained control of this level.
Since the divergence formed at a major historical support, any reclaim of that range would complete the signal and open the way for a broader recovery attempt.
Until that happens, the chart shows momentum improvement but still requires confirmation from price itself.
Disclosure:This article does not contain investment advice or recommendations. Every investment and trading move involves risk, and readers should conduct their own research when making a decision.
Kriptoworld.com accepts no liability for any errors in the articles or for any financial loss resulting from incorrect information.

Tatevik Avetisyan is an editor at Kriptoworld who covers emerging crypto trends, blockchain innovation, and altcoin developments. She is passionate about breaking down complex stories for a global audience and making digital finance more accessible.
📅 Published: December 5, 2025 • 🕓 Last updated: December 5, 2025
