


Solana continued to weaken on the daily chart on Dec. 23, with price breaking below a clearly defined bearish flag pattern, according to TradingView data. SOL traded near $124 at the time of the snapshot, extending a decline that began after repeated failures below the 50 day exponential moving average near $142. The broader structure shows lower highs since November, while selling pressure has stayed consistent during each recovery attempt.
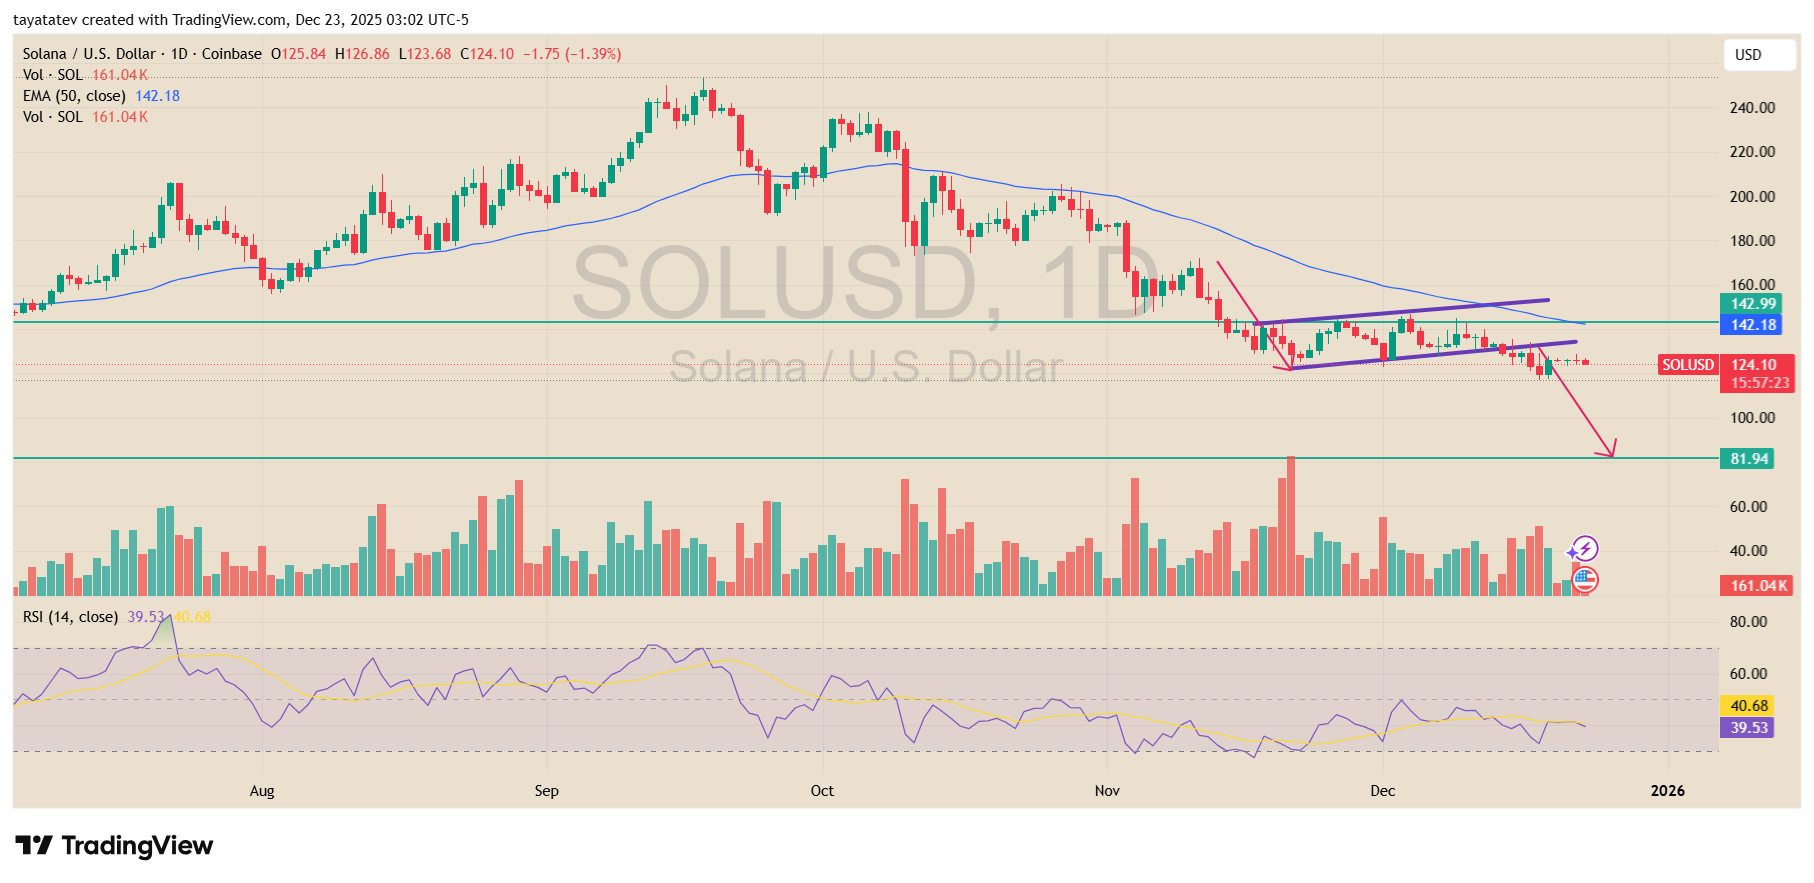
A bearish flag is a continuation pattern that forms after a sharp drop, followed by a short period of sideways or slightly upward consolidation. This pause usually reflects temporary relief rather than renewed demand. In Solana’s case, price moved lower in early November, then consolidated inside a rising channel marked by two parallel trendlines. Volume contracted during this consolidation, which aligned with typical bearish flag behavior.
The chart now shows Solana already breaking below the lower boundary of the flag. This breakdown signals that sellers have regained control and that the prior downtrend is resuming. Price also remains below the 50 day EMA, which continues to slope downward and act as dynamic resistance. Each attempt to reclaim that level failed, reinforcing the bearish bias.
Based on the height of the flagpole and the breakdown level, the pattern projects a further downside move of roughly 33 percent from the current price. That projection points toward the $82 region, which aligns with a marked horizontal support zone on the chart. This area previously acted as a base during earlier consolidation phases, making it a key downside level to monitor.
Momentum indicators support the bearish structure. The daily RSI sits below 40 and remains unable to sustain moves above its signal line. This behavior reflects weak demand and limited upside momentum. Unless Solana reclaims the broken flag structure and the 50 day EMA, the technical setup continues to favor further downside toward the projected target.
Solana Tests Weekly Support as Analyst Flags $90–$100 “Sweep” Risk Before Rally
Solana held near $126 on the weekly chart this week, stabilizing around a long running support zone after a sharp pullback from late 2025 highs, according to TradingView data shared by X user BitBull. The chart shows SOL repeatedly reacting around the same horizontal band near the current price area, while a higher resistance line sits far above near the mid $200s, marking the prior peak region.
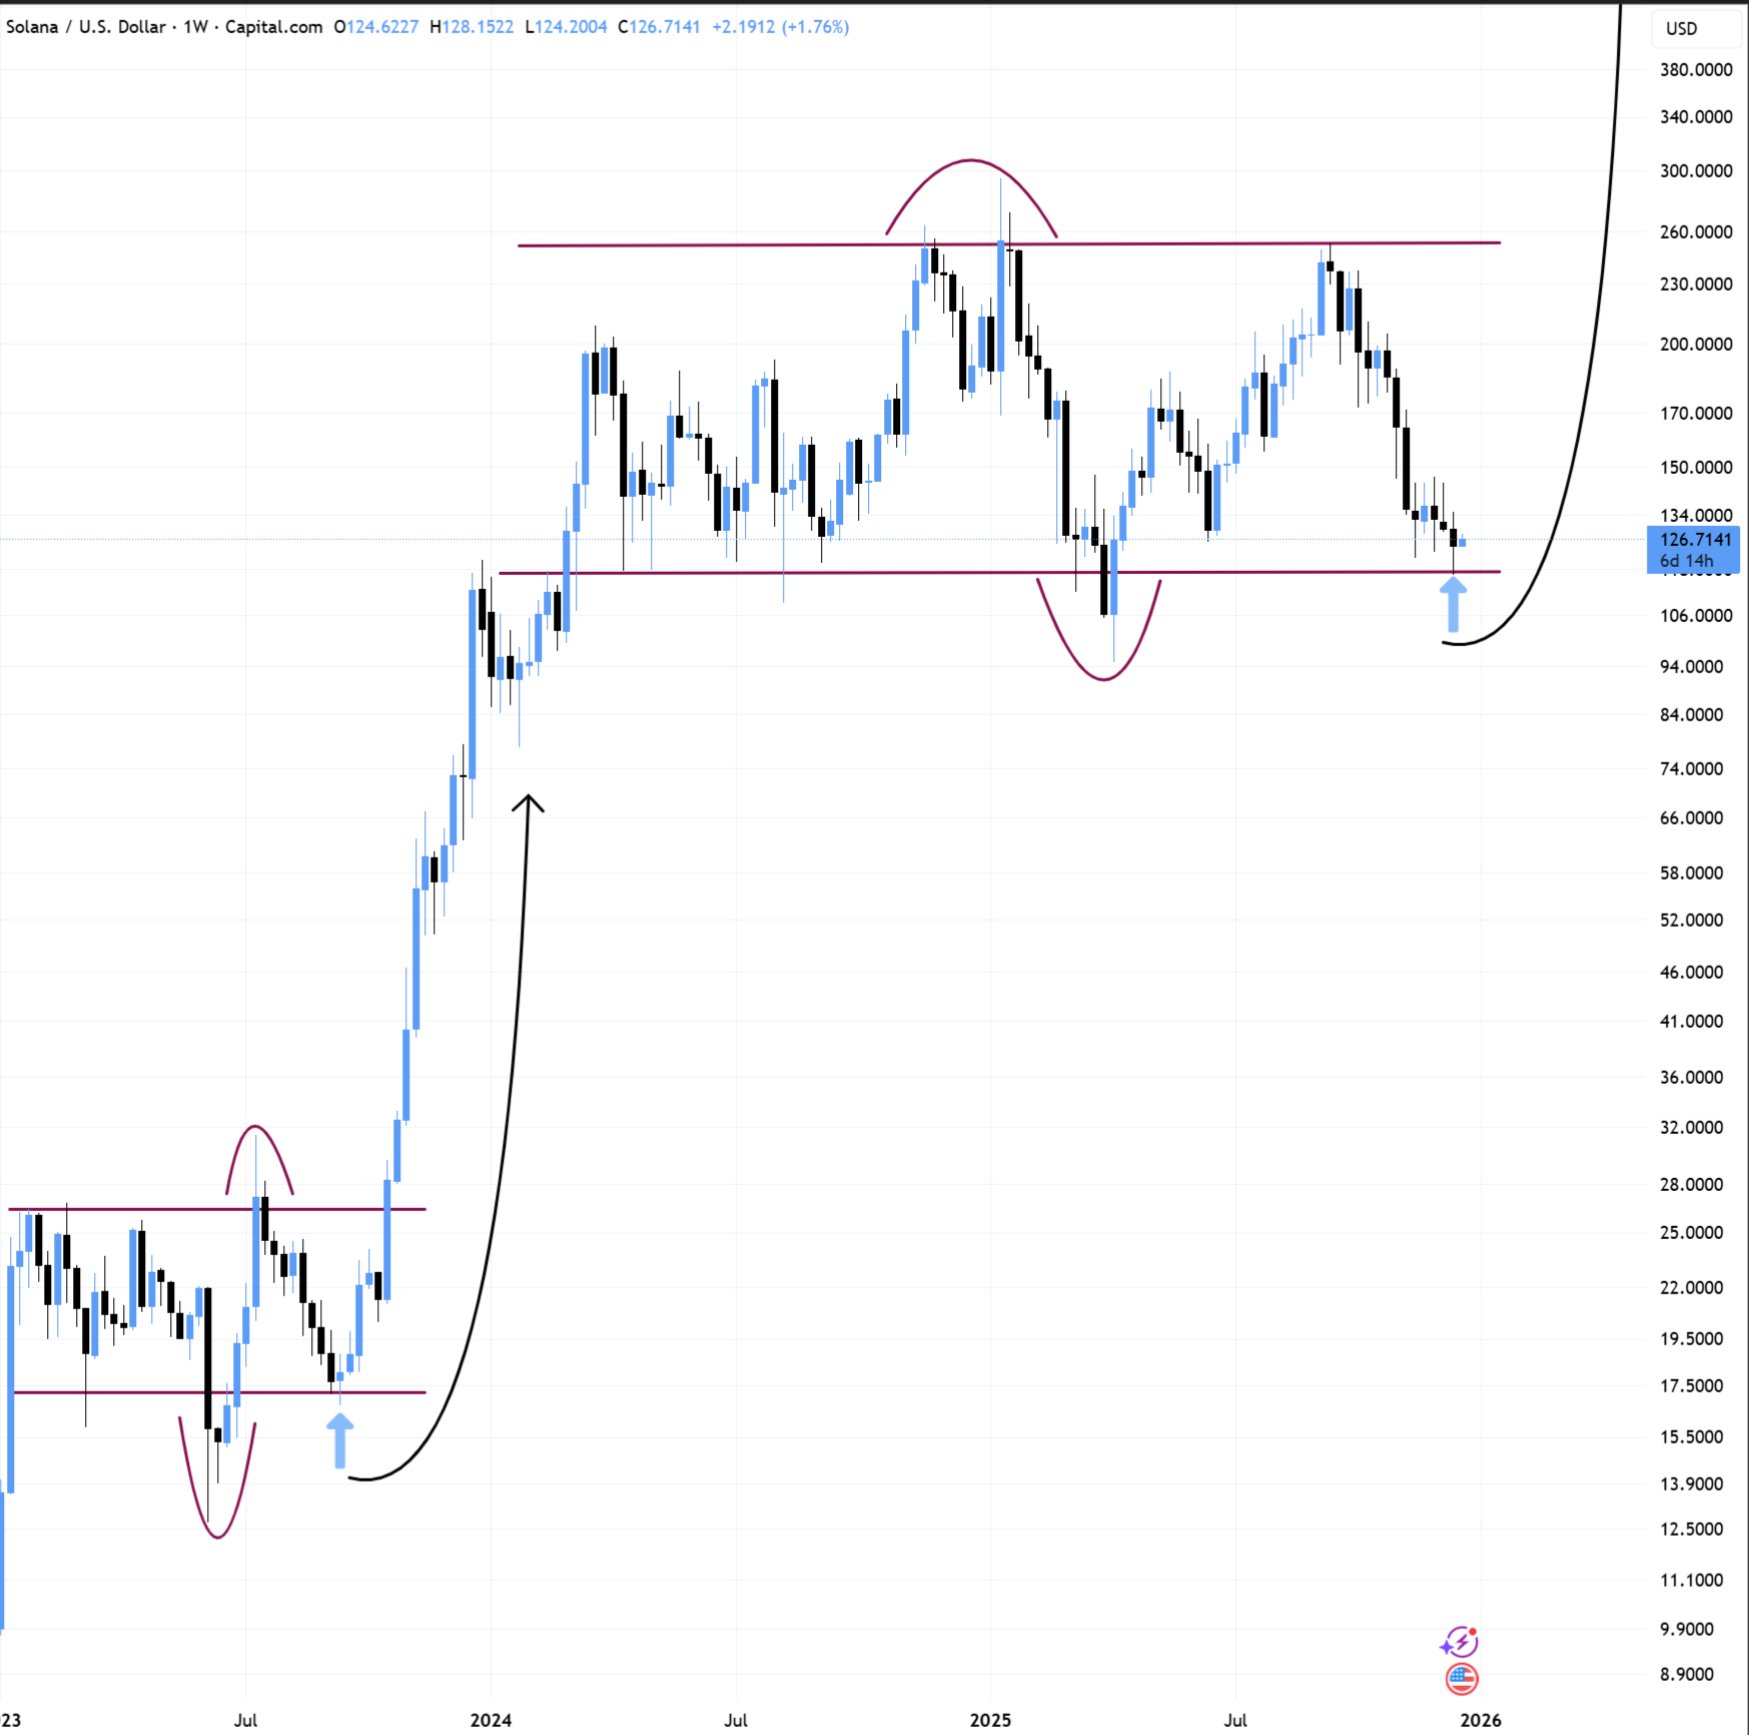
BitBull said SOL “is looking good here,” but added that price could briefly dip below the support zone before moving higher. In market terms, that move is often described as a deviation or liquidity sweep, where price slips under a widely watched level, triggers stops, and then rebounds back into the range. The chart annotation highlights that risk by pointing to the $90–$100 area as a potential downside zone before any recovery attempt.
The analyst said any drop into $90–$100 would be a “buying” area and argued SOL is “due for a rally now.” BitBull also projected a move toward $160–$180 in the first quarter of 2026 before another correction, framing the current zone as a base for a rebound if support continues to hold.
Disclosure:This article does not contain investment advice or recommendations. Every investment and trading move involves risk, and readers should conduct their own research when making a decision.
Kriptoworld.com accepts no liability for any errors in the articles or for any financial loss resulting from incorrect information.

Tatevik Avetisyan is an editor at Kriptoworld who covers emerging crypto trends, blockchain innovation, and altcoin developments. She is passionate about breaking down complex stories for a global audience and making digital finance more accessible.
📅 Published: December 23, 2025 • 🕓 Last updated: December 23, 2025
