


On Dec. 24, 2025, Dogecoin printed a clear bearish flag pattern on the daily DOGE USD chart, based on TradingView data from Coinbase.
The chart showed DOGE trading near $0.127 after weeks of steady lower highs and lower lows, while price stayed capped beneath a descending trendline and the 50 day exponential moving average near $0.150.
Stay ahead in the crypto world – follow us on X for the latest updates, insights, and trends!🚀
The broader structure remained bearish, with each rebound failing under resistance and volume staying muted during consolidation.
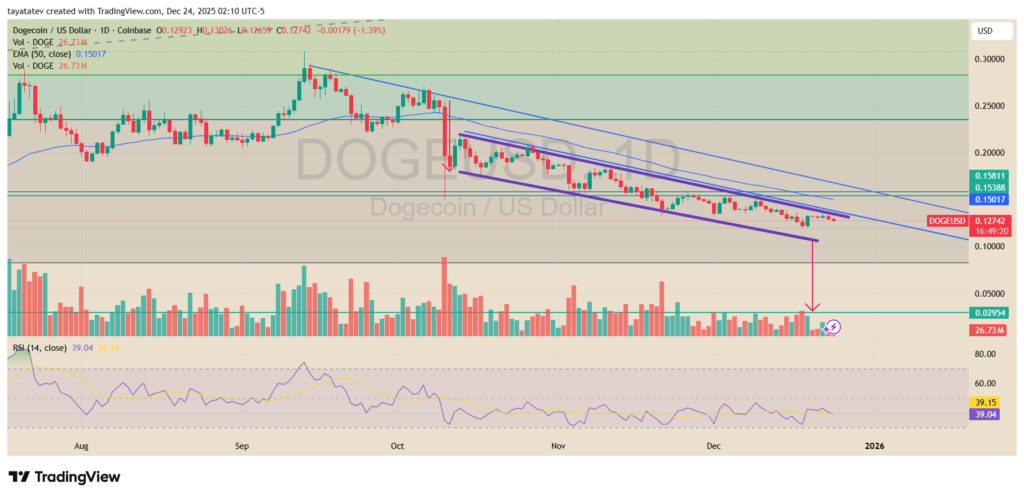
A bearish flag is a continuation pattern that forms after a sharp drop, followed by a brief period of downward sloping or sideways consolidation.
This pause reflects temporary balance rather than renewed demand, and it often resolves in the direction of the prior move. In Dogecoin’s case, the flag developed after the October breakdown, with price compressing inside a narrow descending channel marked by parallel trendlines.
The chart showed price grinding lower within the flag, while momentum indicators stayed weak.
The relative strength index hovered near 39, signaling persistent bearish pressure without reaching extreme oversold levels. Volume also contracted during the consolidation phase, which aligns with typical bearish flag behavior and suggests sellers retained control.
If the bearish flag confirms with a decisive breakdown below the lower boundary of the pattern, the measured move projects a decline of roughly 77% from the current price. That projection points toward the $0.03 area, near $0.029, which aligns with a prior historical demand zone visible on the chart.
Until price reclaims key resistance levels, the daily structure continues to favor downside risk rather than a sustained recovery.
Dogecoin Faces Trendline Rejection on 4 Hour Chart
On Dec. 23, 2025, Dogecoin traded below a descending trendline on the four hour DOGE USD chart, according to TradingView data shared by Token Talk.
Price hovered near $0.128 after failing to hold a short term rebound, while repeated attempts to push higher stalled under the same downward sloping resistance that has capped price action for several sessions.
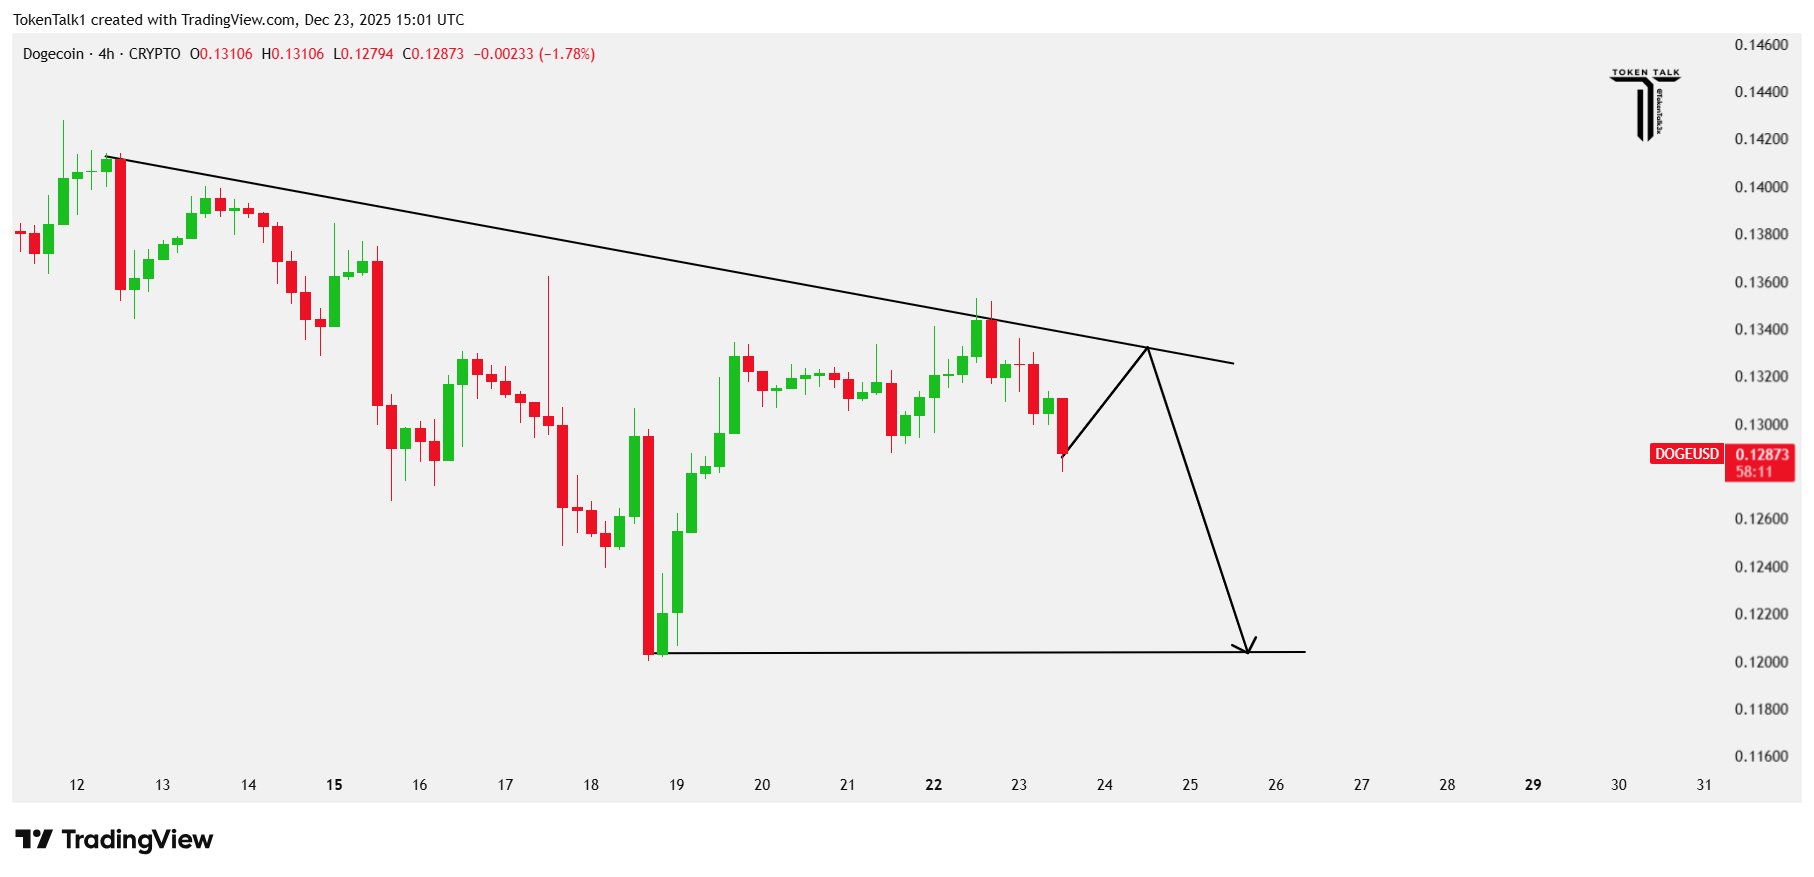
A descending trendline marks a series of lower highs and reflects sustained selling pressure.
When price approaches this line and fails to break above it, the rejection often signals that sellers remain in control.
In this case, Dogecoin moved into the trendline, paused briefly, and then turned lower, reinforcing the bearish structure.
The chart also showed price trading within a defined range, with support near the $0.12 area. After the latest rejection, price began drifting back toward that lower boundary. This behavior suggests the market is rotating inside the range rather than starting a new uptrend.
If selling pressure continues and price holds below the descending trendline, Dogecoin may revisit range support near $0.12.
Until price reclaims the trendline with strength, the short term structure continues to favor downside risk over a sustained recovery.
Disclosure:This article does not contain investment advice or recommendations. Every investment and trading move involves risk, and readers should conduct their own research when making a decision.
Kriptoworld.com accepts no liability for any errors in the articles or for any financial loss resulting from incorrect information.

Tatevik Avetisyan is an editor at Kriptoworld who covers emerging crypto trends, blockchain innovation, and altcoin developments. She is passionate about breaking down complex stories for a global audience and making digital finance more accessible.
📅 Published: December 24, 2025 • 🕓 Last updated: December 24, 2025
