


Ethereum stayed within a broader uptrend on the daily chart as it traded near $3,135 on Bitstamp on Jan. 12.
Price remained above rising structural support while holding close to the 50-day exponential moving average near $3,124.
Stay ahead in the crypto world – follow us on X for the latest updates, insights, and trends!🚀
As a result, the higher-low structure from late 2025 stayed intact despite recent volatility.
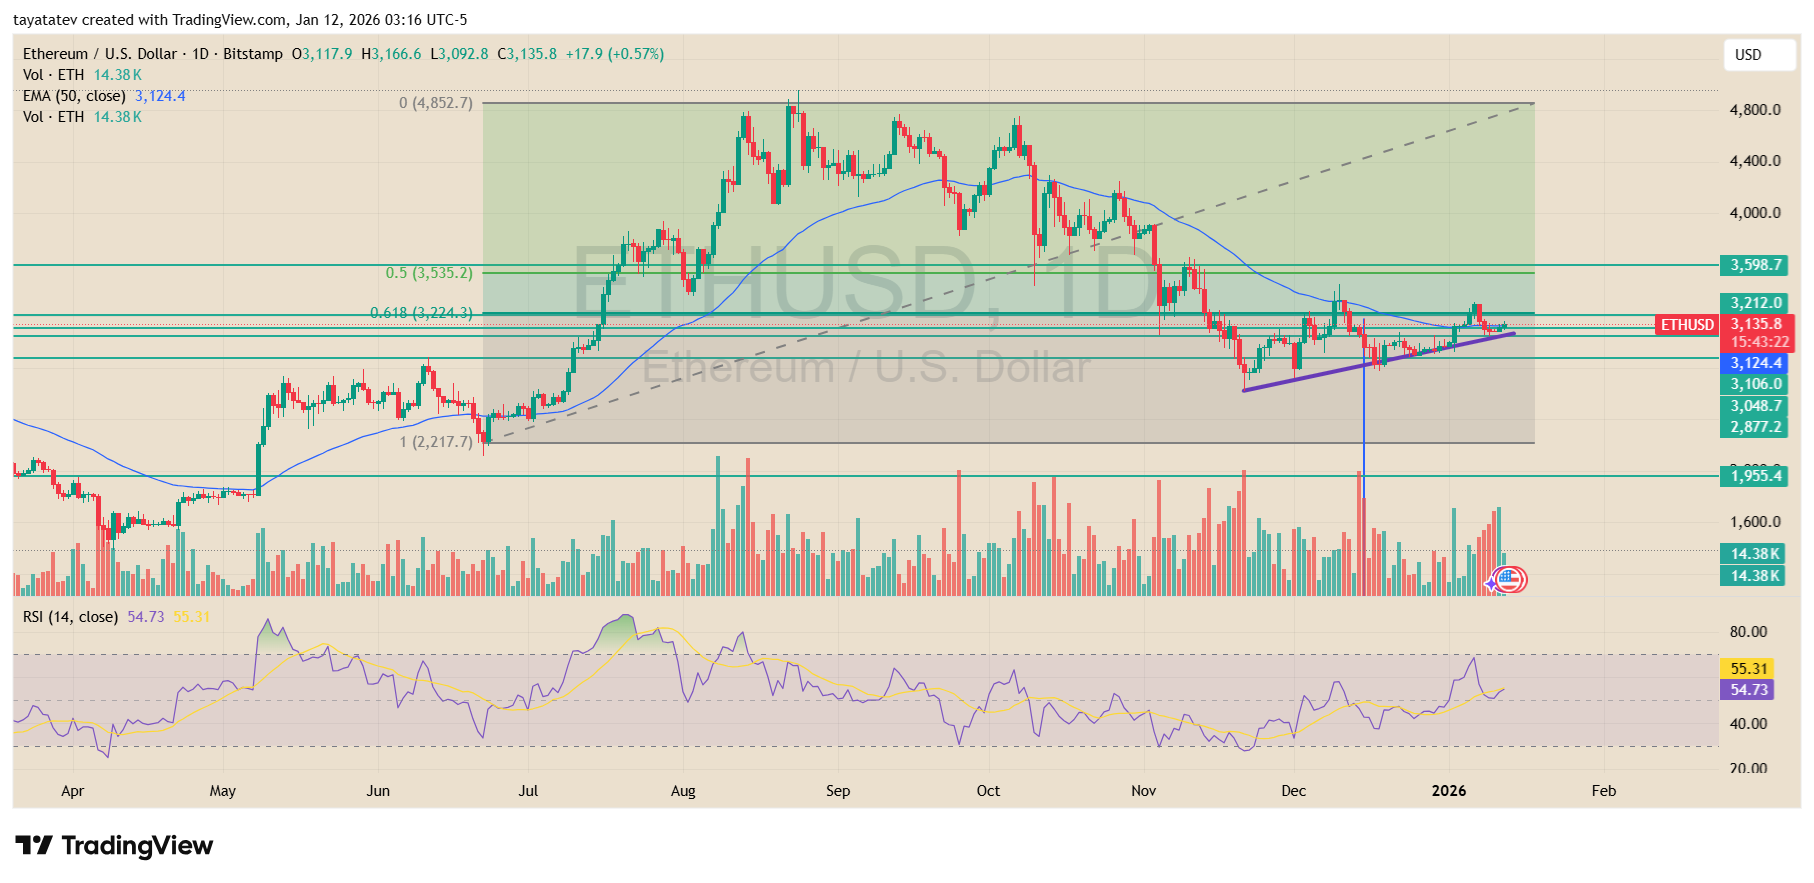
At the same time, Ethereum tested the Fibonacci golden zone twice during the latest pullback. Price dipped into the 0.5–0.618 retracement area, near $3,224 and $3,535 on the broader range, before stabilizing.
Both tests attracted buying interest, which limited downside follow-through and kept price within the rising channel drawn from the July lows.
The repeated defense of this zone reinforced the prevailing uptrend structure rather than signaling a breakdown.
Meanwhile, short-term price action compressed into a rising wedge supported by an upward sloping trendline.
Ethereum briefly pushed lower in early December but quickly reclaimed the structure, which shifted momentum back toward higher levels.
Volume expanded during the rebound phase, while the most recent sessions showed more balanced trading, suggesting consolidation rather than distribution.
Momentum indicators also aligned with this view. The daily RSI hovered near the mid-50s, moving higher from earlier lows and staying above neutral.
This reading reflected improving momentum without entering overbought conditions.
In addition, price traded back above the 50-day EMA after spending several sessions below it, which historically marked trend continuation phases during this cycle.
Taken together, the chart showed Ethereum reverting toward the higher end of its recent range after holding the golden zone twice.
While resistance remained near the descending trendline from the November peak, the broader structure continued to favor the upside as long as price held above rising support and the reclaimed moving average.
Ethereum Faces Key Resistance as Price Tries to Build Strength
Meanwhile, Ethereum showed early signs of recovery on the daily ETHUSDT chart as it traded near $3,142 on Binance, but price remained capped below a major resistance zone around $3,200.
The level marked a former support area that flipped into resistance after the sharp breakdown in November.
Since then, multiple rebound attempts stalled in this range, keeping upside momentum contained.
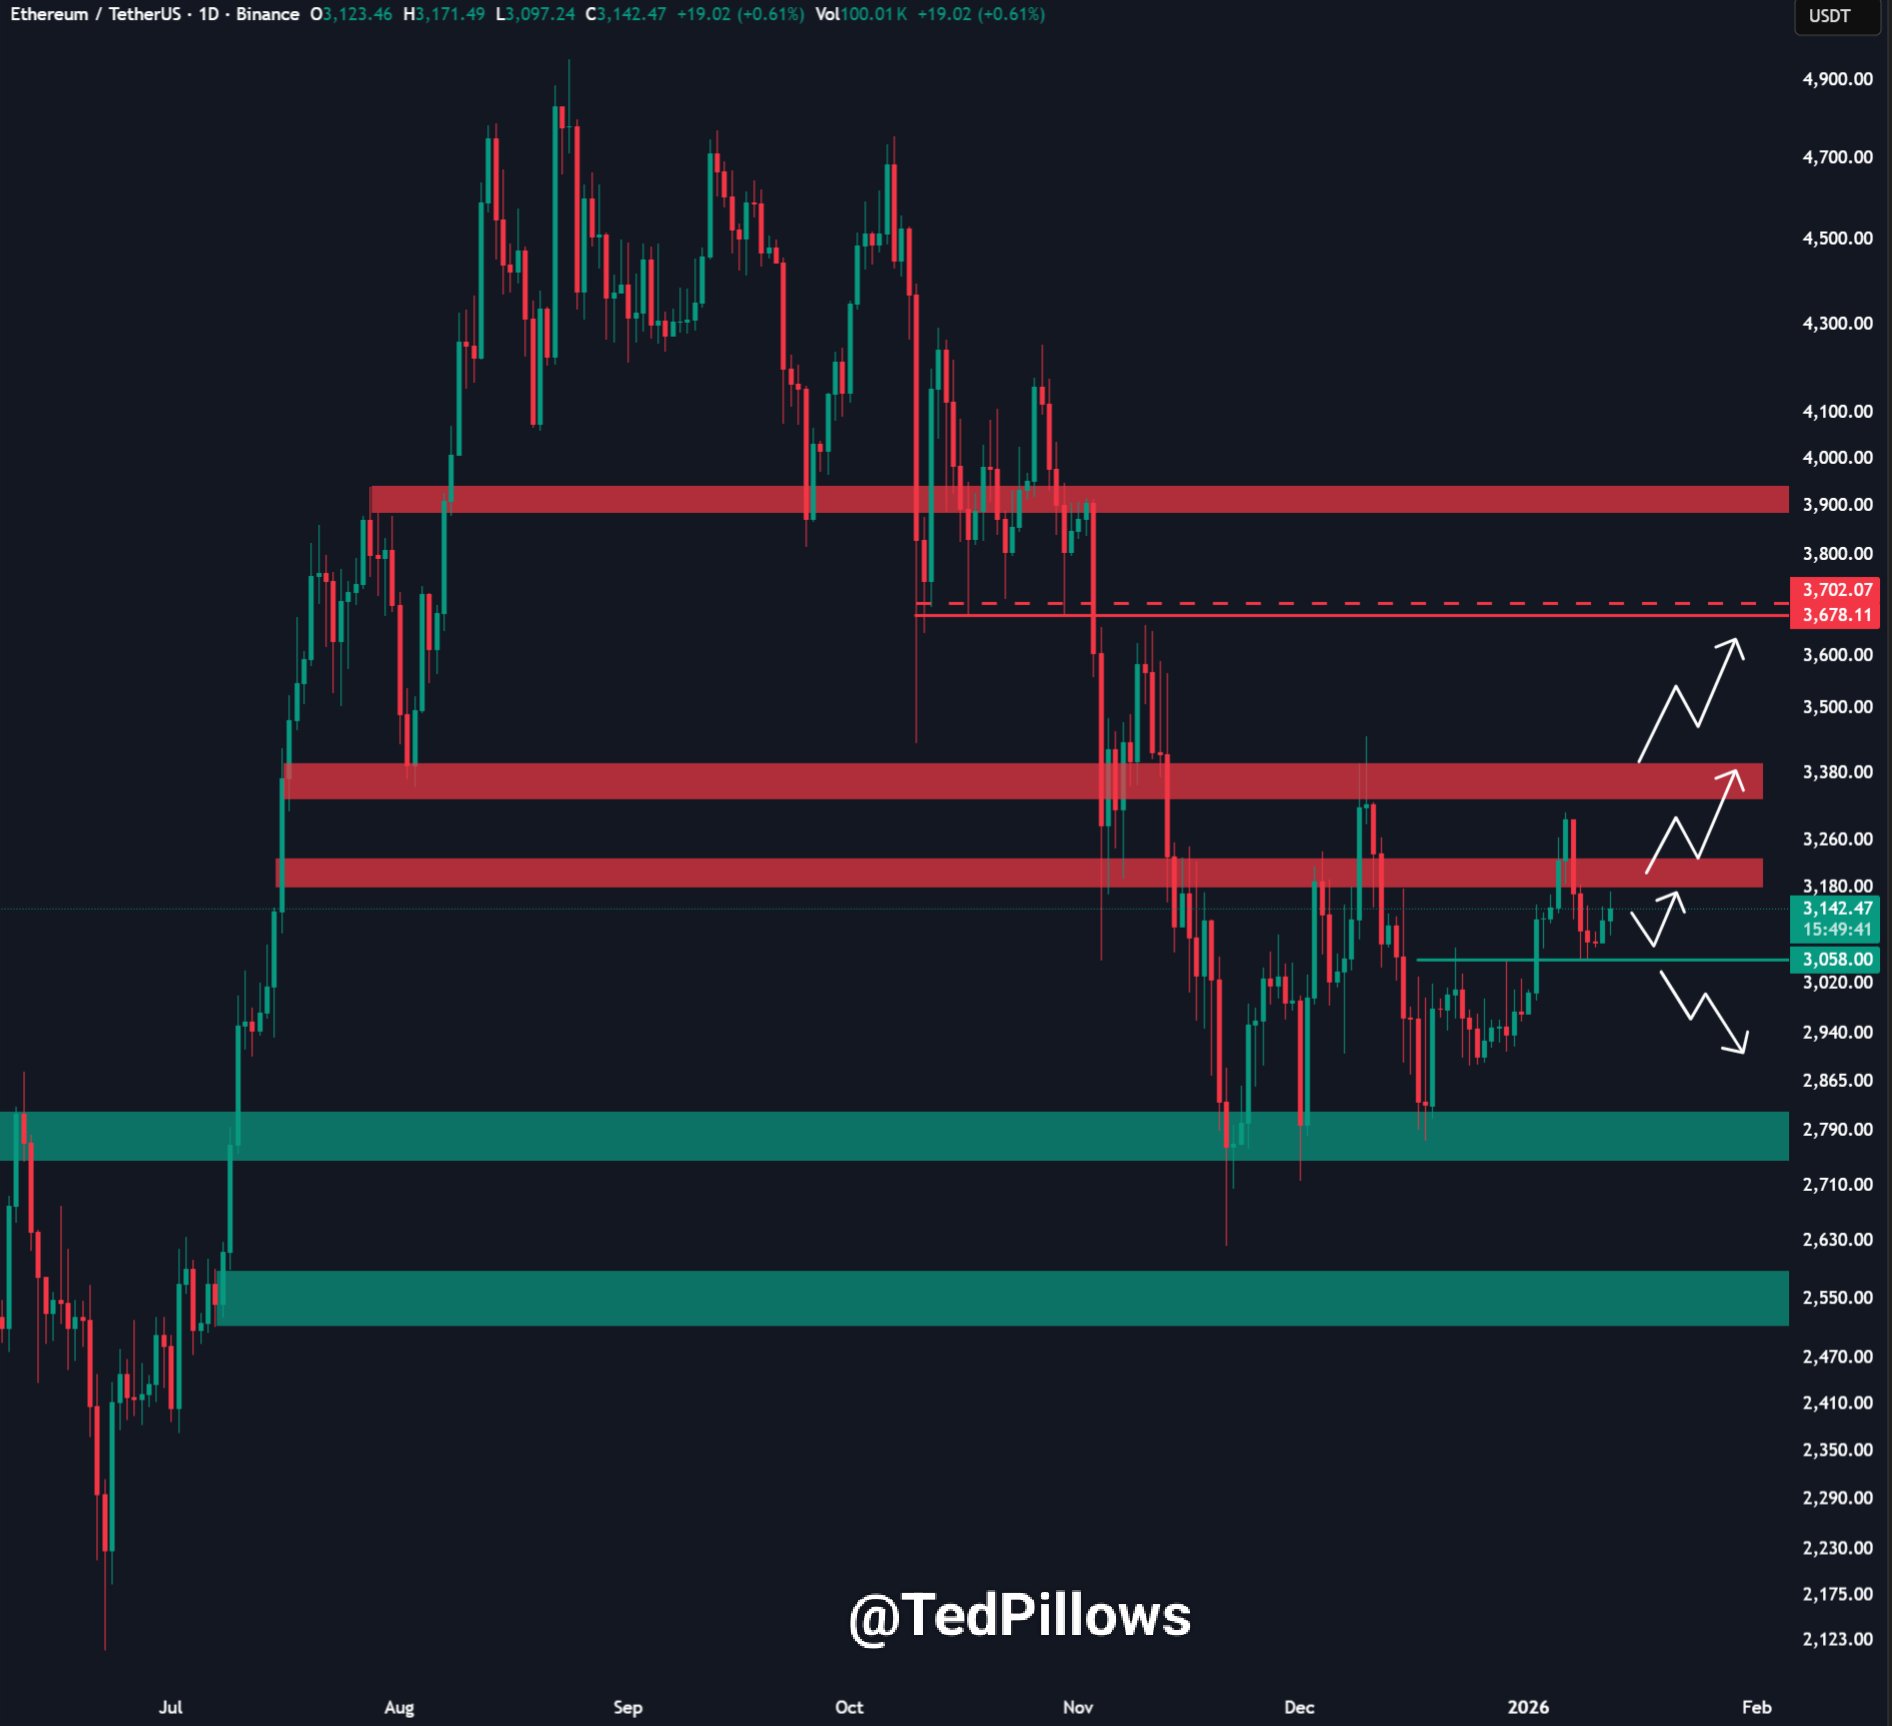
At the same time, Ethereum rebounded from a lower demand zone between roughly $2,700 and $2,800, where buyers repeatedly stepped in during December.
That zone acted as a clear downside buffer, limiting further losses and setting the base for the current recovery attempt.
From there, price formed a series of higher lows, signaling short-term stabilization rather than continued selloff.
However, the broader structure showed Ethereum trading within a wide consolidation range.
The mid-range resistance near $3,180–$3,260 aligned with prior breakdown levels and visible supply zones on the chart.
Each approach toward this area met selling pressure, which reinforced its importance. As long as price stayed below $3,200, upside moves risked fading back toward the $3,050–$3,000 area.
Meanwhile, price action above $3,050 suggested improving short-term strength, but not a confirmed trend shift.
The market remained range-bound, with Ethereum oscillating between nearby resistance and reclaimed minor support.
This structure pointed to indecision rather than a clean breakout, especially after the steep decline from the October highs.
In this setup, Ethereum needed a decisive reclaim of the $3,200 level to shift momentum higher.
Until that happened, rallies into resistance were likely to face pullbacks, keeping price action contained within the broader consolidation zone visible on the daily chart.
Disclosure:This article does not contain investment advice or recommendations. Every investment and trading move involves risk, and readers should conduct their own research when making a decision.
Kriptoworld.com accepts no liability for any errors in the articles or for any financial loss resulting from incorrect information.

Tatevik Avetisyan is an editor at Kriptoworld who covers emerging crypto trends, blockchain innovation, and altcoin developments. She is passionate about breaking down complex stories for a global audience and making digital finance more accessible.
📅 Published: January 12, 2026 • 🕓 Last updated: January 12, 2026
