


XRP rose 0.59% on the day to about $2.064 on Coinbase, after trading between $2.045 and $2.078, according to the TradingView daily chart timestamped Jan. 13, 2026 (UTC).
The bounce pushed price back toward the 50 day exponential moving average near $2.070, but XRP did not reclaim it at the close, which kept the broader downtrend structure in place.
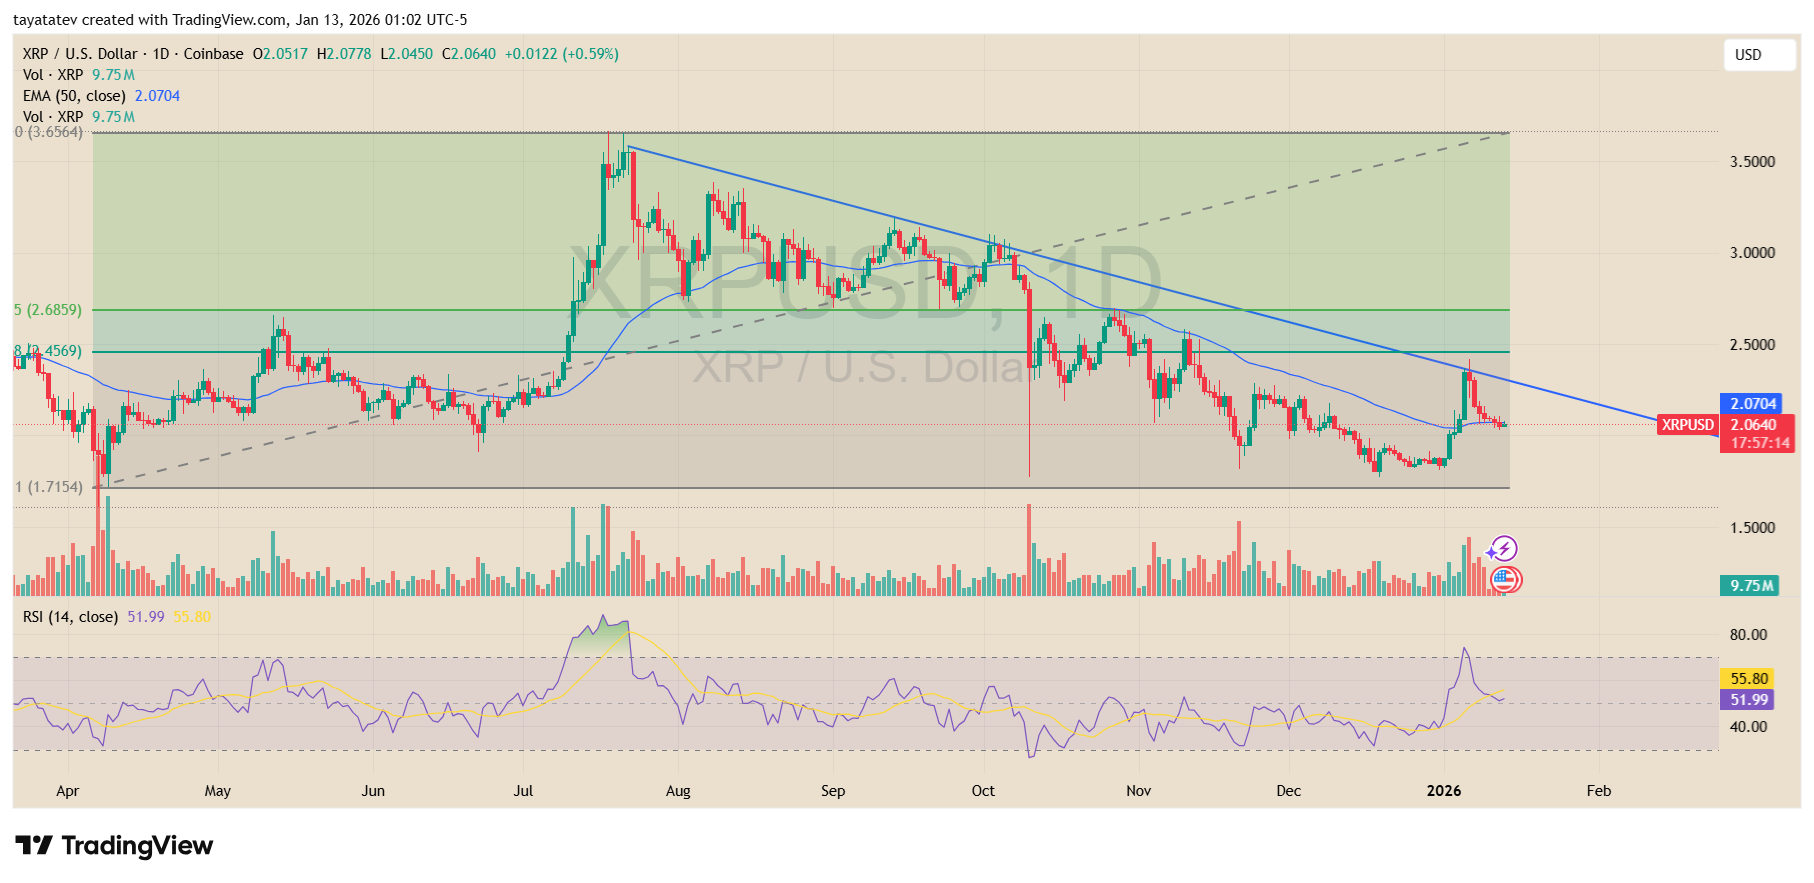
The chart shows XRP still trading below a descending trendline that has guided lower highs since the late summer peak.
Even when price spiked in early January, the move faded before it could break that sloping resistance.
As a result, the latest rebound reads as a reaction rally inside the same declining channel, not a confirmed trend change.
Fibonacci retracement levels on the chart mark a “golden zone” band around roughly $2.46 to $2.69.
XRP remains below that area, and price has not managed to push into it with follow through.
Because the market has not retaken that zone, the recovery still lacks the kind of structural reclaim that typically signals a stronger reversal attempt on the daily timeframe.
For now, the level to watch sits near $2.70. The chart’s $2.6859 line aligns with the upper part of the retracement band, and a sustained move above $2.70 would also place price back into the higher range that dominated the prior consolidation.
Until XRP trades above $2.70 and holds it, the price action does not meet the threshold to treat the move as a new uptrend starting on this chart.
Momentum indicators stayed mixed. The 14 day RSI printed near 52, which sits close to neutral and suggests the rebound has not produced strong bullish momentum yet.
Volume on the session came in around 9.75 million XRP, which did not stand out versus prior spikes that accompanied sharper trend moves on the same chart.
XRP market cap retests 21 month EMA after triangle breakout, chart post says
Meanwhile, a chart shared on X by user JD (@jaydee_757) compared XRP’s market capitalization setup in early 2026 with a similar pattern from 2017 to 2018.
The post said XRP’s market cap previously broke out of a triangle in 2017, then consolidated for more than a year, and then retested the 21 month exponential moving average (EMA), shown as a blue line on the monthly chart.
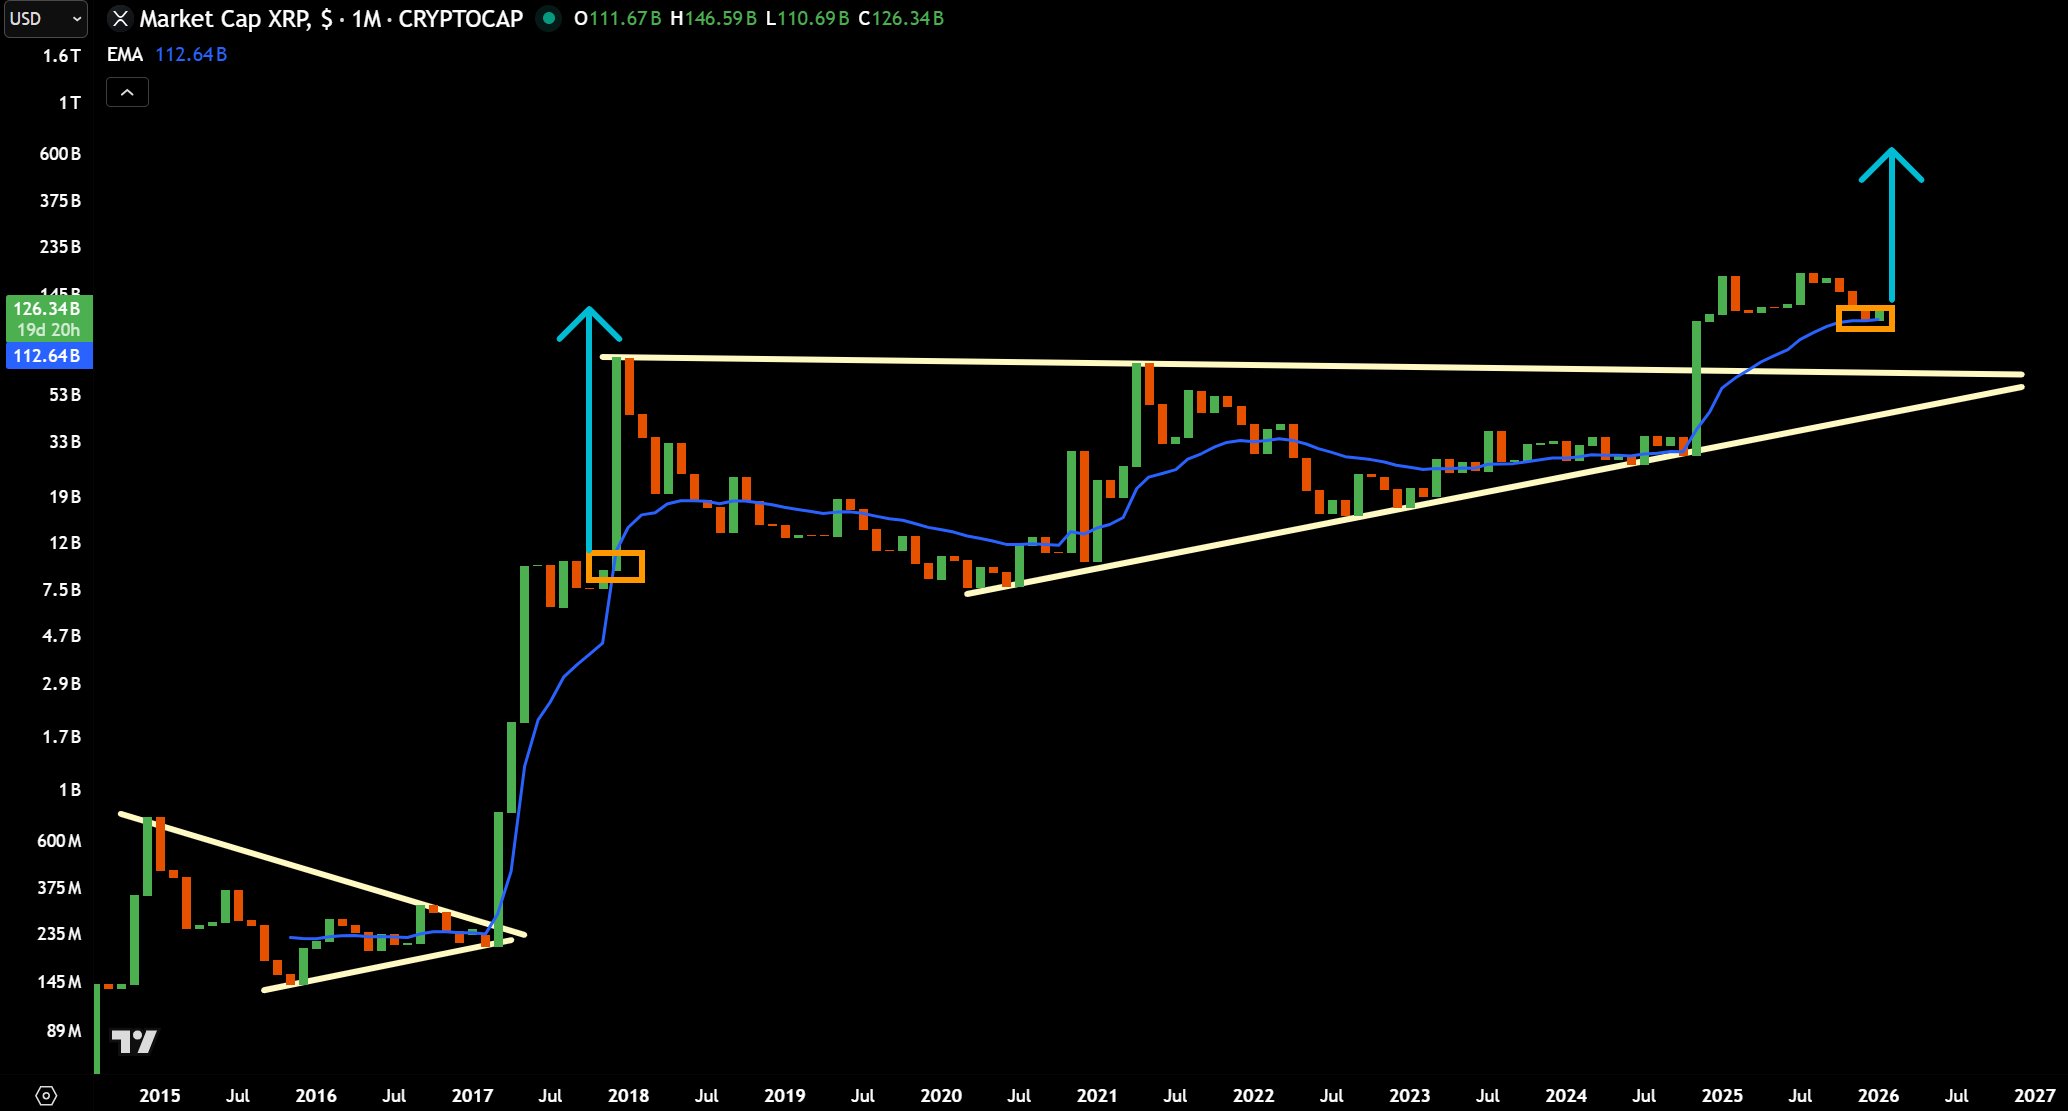
After that retest, the post said, XRP’s market cap surged into January 2018 before a sharp reversal.
The chart shows a long consolidation phase after the 2017 breakout, followed by a steep vertical move, and then a major drop that erased much of the advance.
The same chart then mapped a larger triangle structure that formed across later years, with price action compressing toward a rising lower trendline while the top side stayed relatively flat.
In the most recent section, the chart showed a breakout above that structure and then a pullback that brought the market cap back toward the 21 month EMA area.
JD described the current move as a January 2026 bounce off the 21 month EMA following the triangle breakout.
The post framed the earlier cycle as a template, while the chart’s right edge highlighted a consolidation zone after the breakout and rebound.
Disclosure:This article does not contain investment advice or recommendations. Every investment and trading move involves risk, and readers should conduct their own research when making a decision.
Kriptoworld.com accepts no liability for any errors in the articles or for any financial loss resulting from incorrect information.

Tatevik Avetisyan is an editor at Kriptoworld who covers emerging crypto trends, blockchain innovation, and altcoin developments. She is passionate about breaking down complex stories for a global audience and making digital finance more accessible.
📅 Published: January 13, 2026 • 🕓 Last updated: January 13, 2026
