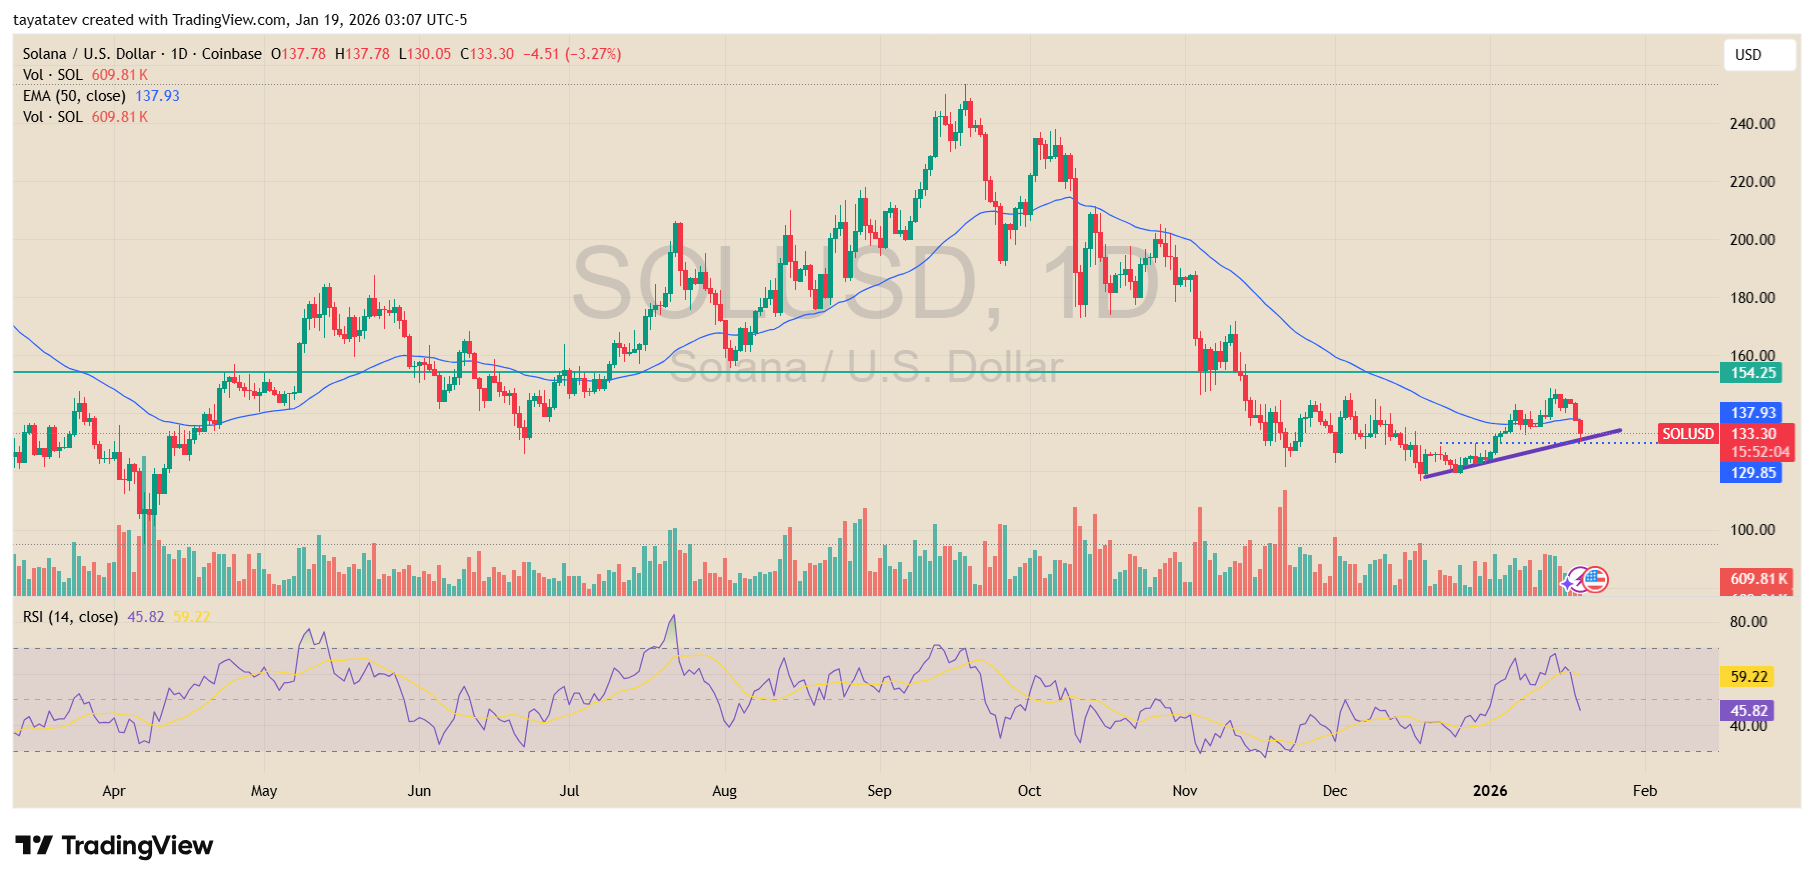
Solana fell sharply on the daily chart on Jan. 19, yet the broader structure still points to an intact uptrend.
SOL traded near $133 after a steep red candle, following a rejection below the 50 day exponential moving average, which sat near $138 at the time of the session.
The daily chart showed Solana pulling back after a brief recovery attempt earlier in January. Even so, higher lows remained visible compared with the December base near the $120–125 area.
That structure signaled that buyers still defended key levels, although momentum weakened in the short term.
Volume during the latest drop increased, showing stronger selling pressure than in recent sessions, while price stayed above the broader trend support.
Meanwhile, the relative strength index moved lower after approaching the upper 50s earlier this month. The pullback pushed RSI toward the mid 40s, reflecting cooling momentum rather than a clear breakdown.
In addition, Solana continued to trade below the 50 day EMA, which acted as near term resistance after capping multiple upside attempts since November. This alignment showed consolidation inside a wider uptrend rather than a confirmed trend reversal.
From a technical perspective, Solana remained in an upward structure as long as price held above the rising trendline and stayed well above the December lows.
The recent sell off marked a strong daily setback, yet it did not erase the series of higher lows formed over recent weeks.
As a result, the chart continued to show an uptrend under pressure, with short term weakness unfolding inside a still constructive medium term setup.
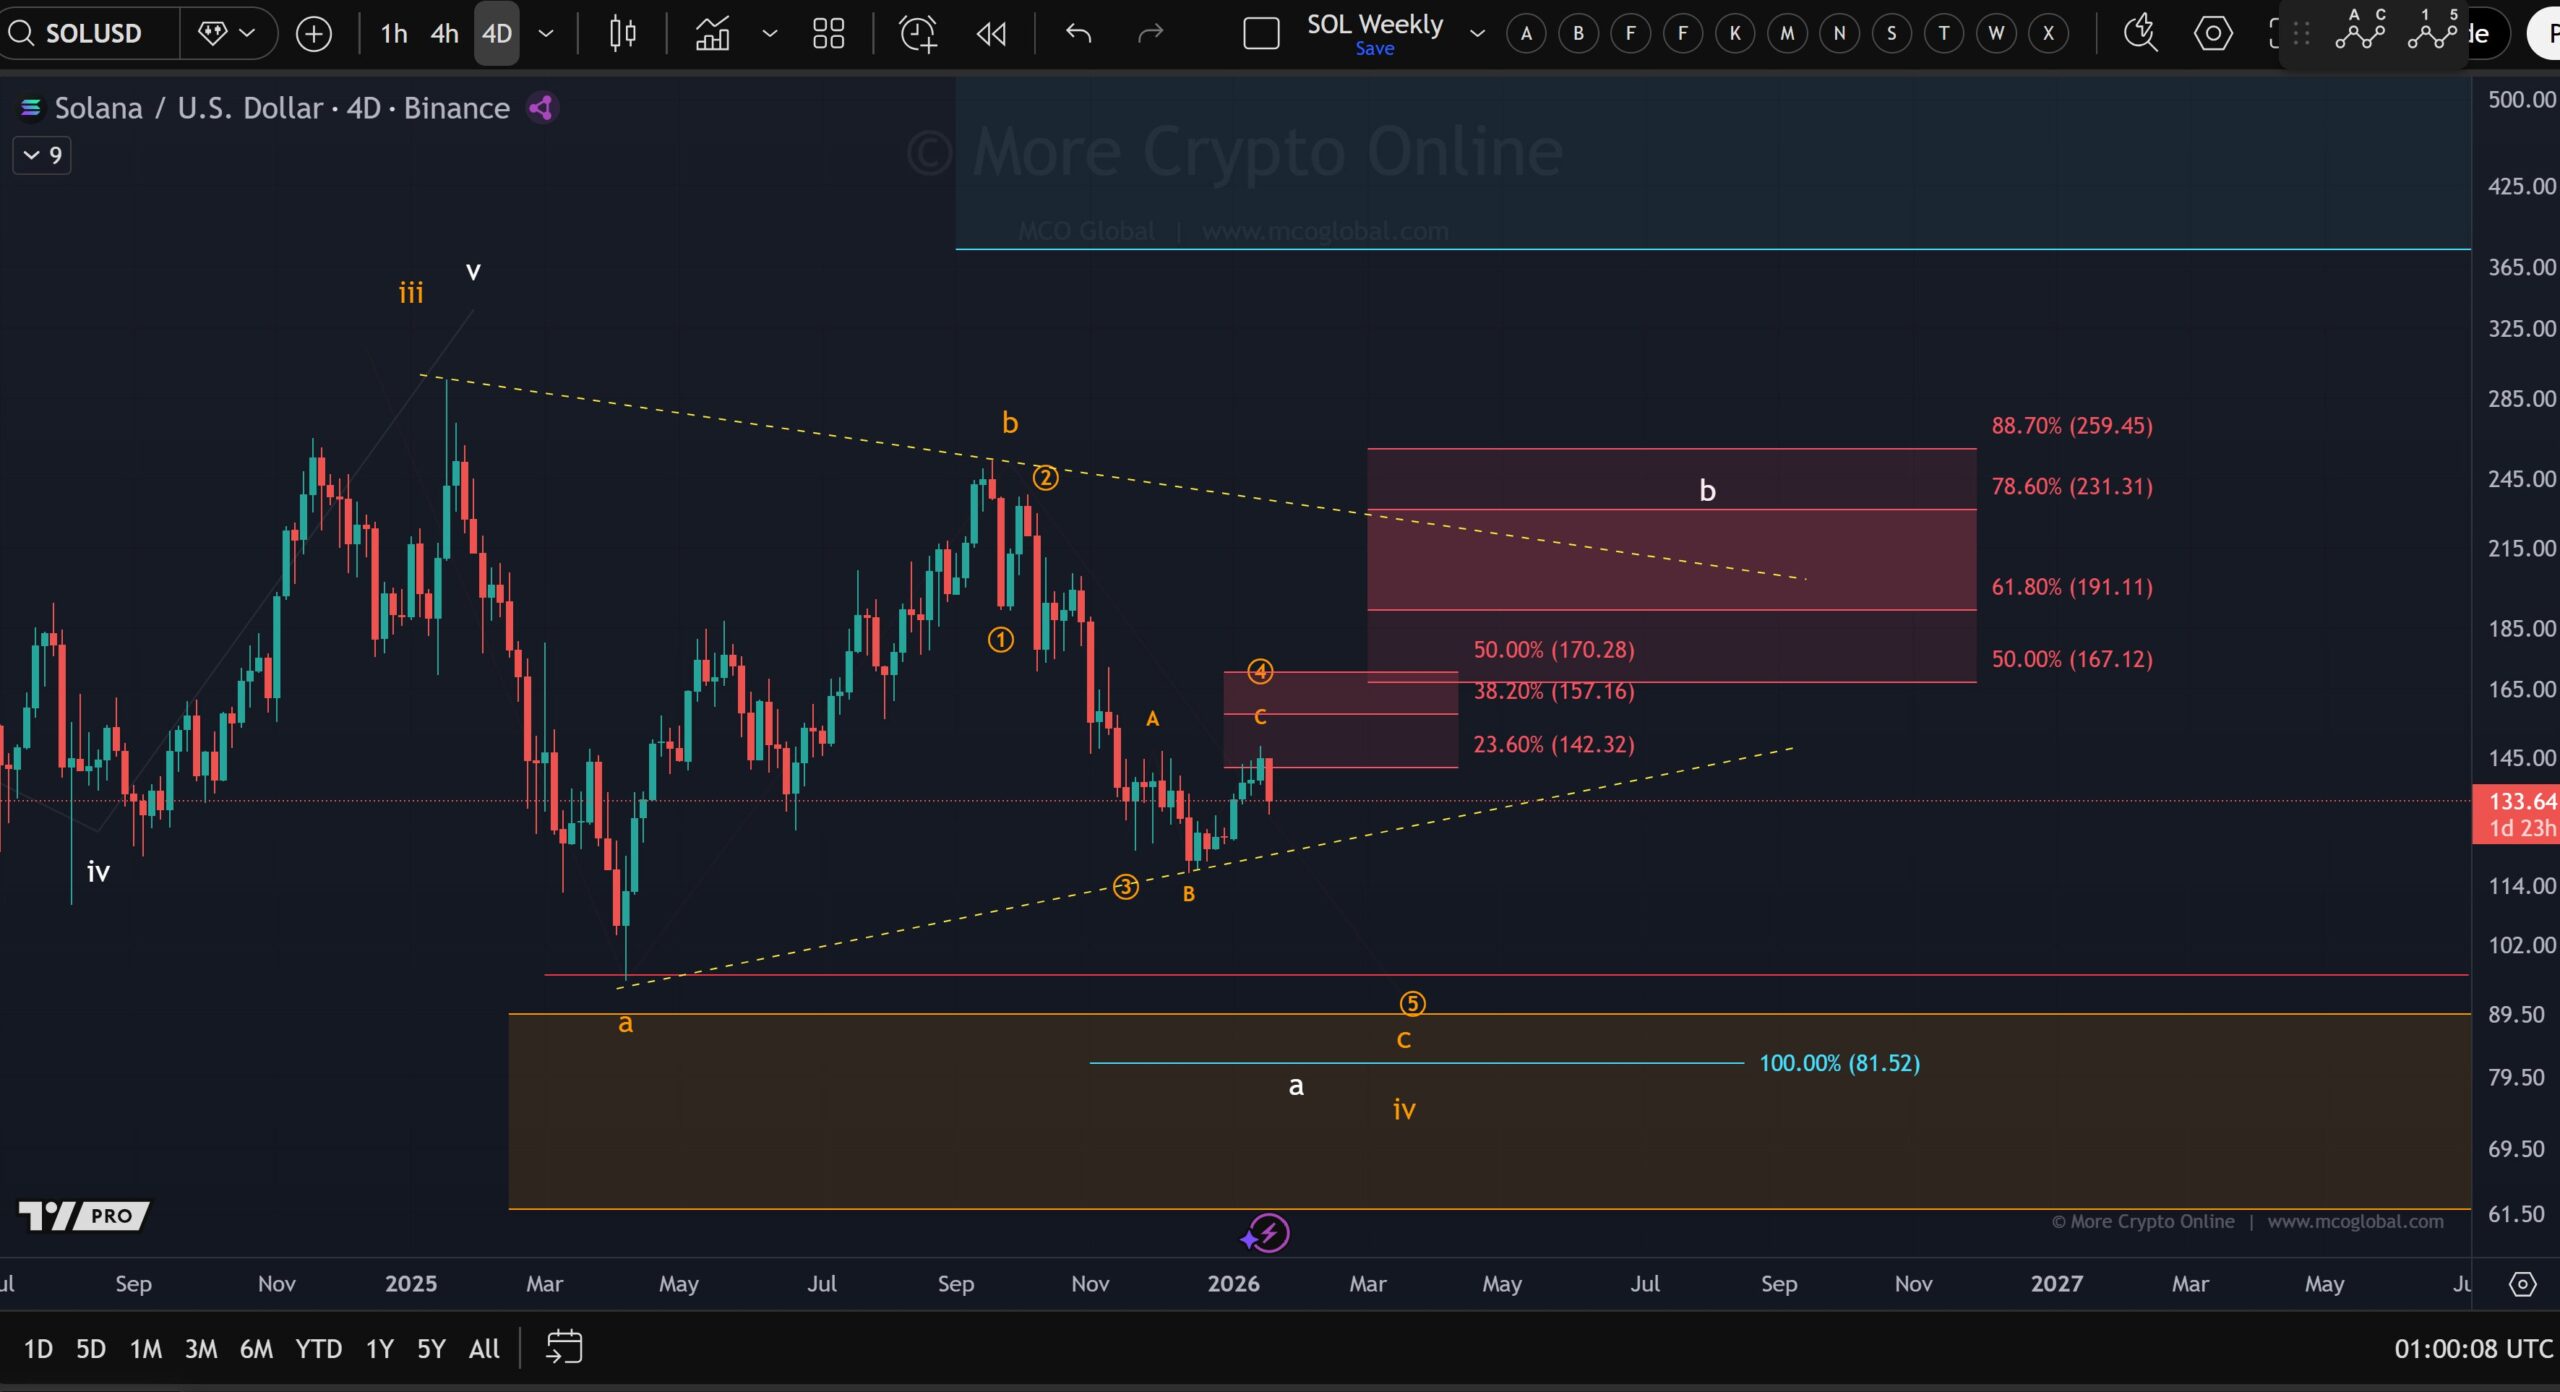
Solana Sees Strong Rejection Near Wave Resistance on Higher Time Frame
Solana faced a strong rejection from a key resistance zone on the higher time frame chart, according to a four day SOL U.S. dollar setup shared on Jan. 19.
Price pulled back after failing to hold above the area aligned with a broader corrective structure, showing renewed selling pressure after the recent rebound attempt.
The chart highlighted Solana turning lower near what was marked as a wave four resistance zone.
That area capped upside progress after price climbed from the late 2025 lows. As a result, the rejection confirmed that sellers remained active at higher levels, even as the broader structure continued to unfold above the major long term support zone near the $80 to $90 range.
At the same time, Solana stayed within a rising channel that has guided price action since the prior cycle low.
The pullback followed a series of lower highs on the higher time frame, suggesting consolidation rather than a completed trend shift.
Price also remained well above the deepest retracement level marked on the chart, keeping the wider structure intact despite the sharp rejection.
From a structural view, the chart showed Solana transitioning from a recovery phase into another corrective leg.
The reaction at resistance underlined the importance of the wave four area as a technical barrier.
While momentum weakened after the rejection, the market continued to trade above long term support, leaving the broader trend structure in place as the next phase developed.
Disclosure:This article does not contain investment advice or recommendations. Every investment and trading move involves risk, and readers should conduct their own research when making a decision.
Kriptoworld.com accepts no liability for any errors in the articles or for any financial loss resulting from incorrect information.
Tatevik Avetisyan is an editor at Kriptoworld who covers emerging crypto trends, blockchain innovation, and altcoin developments.
She is passionate about breaking down complex stories for a global audience and making digital finance more accessible.
📅 Published: January 19, 2026 • 🕓 Last updated: January 19, 2026
While the crypto market panics, Bitcoin Cash is thriving. BCH has set multiple records in February despite extreme market fear.
The network has seen increased...
Bitcoin traded near $66,505 on the 15-minute BTCUSD index chart as price continued to slide within a descending channel.
The move followed a failed bounce...