


Bitcoin fell sharply in the prior session, dropping by about $4,000 from the $93,700 area to near $89,700 on the daily close, based on Bitstamp data.
The move followed a rejection from a descending trendline and pushed price back below the 50 day exponential moving average.
Stay ahead in the crypto world – follow us on X for the latest updates, insights, and trends!🚀
As a result, sellers regained short term control after a brief January rebound.
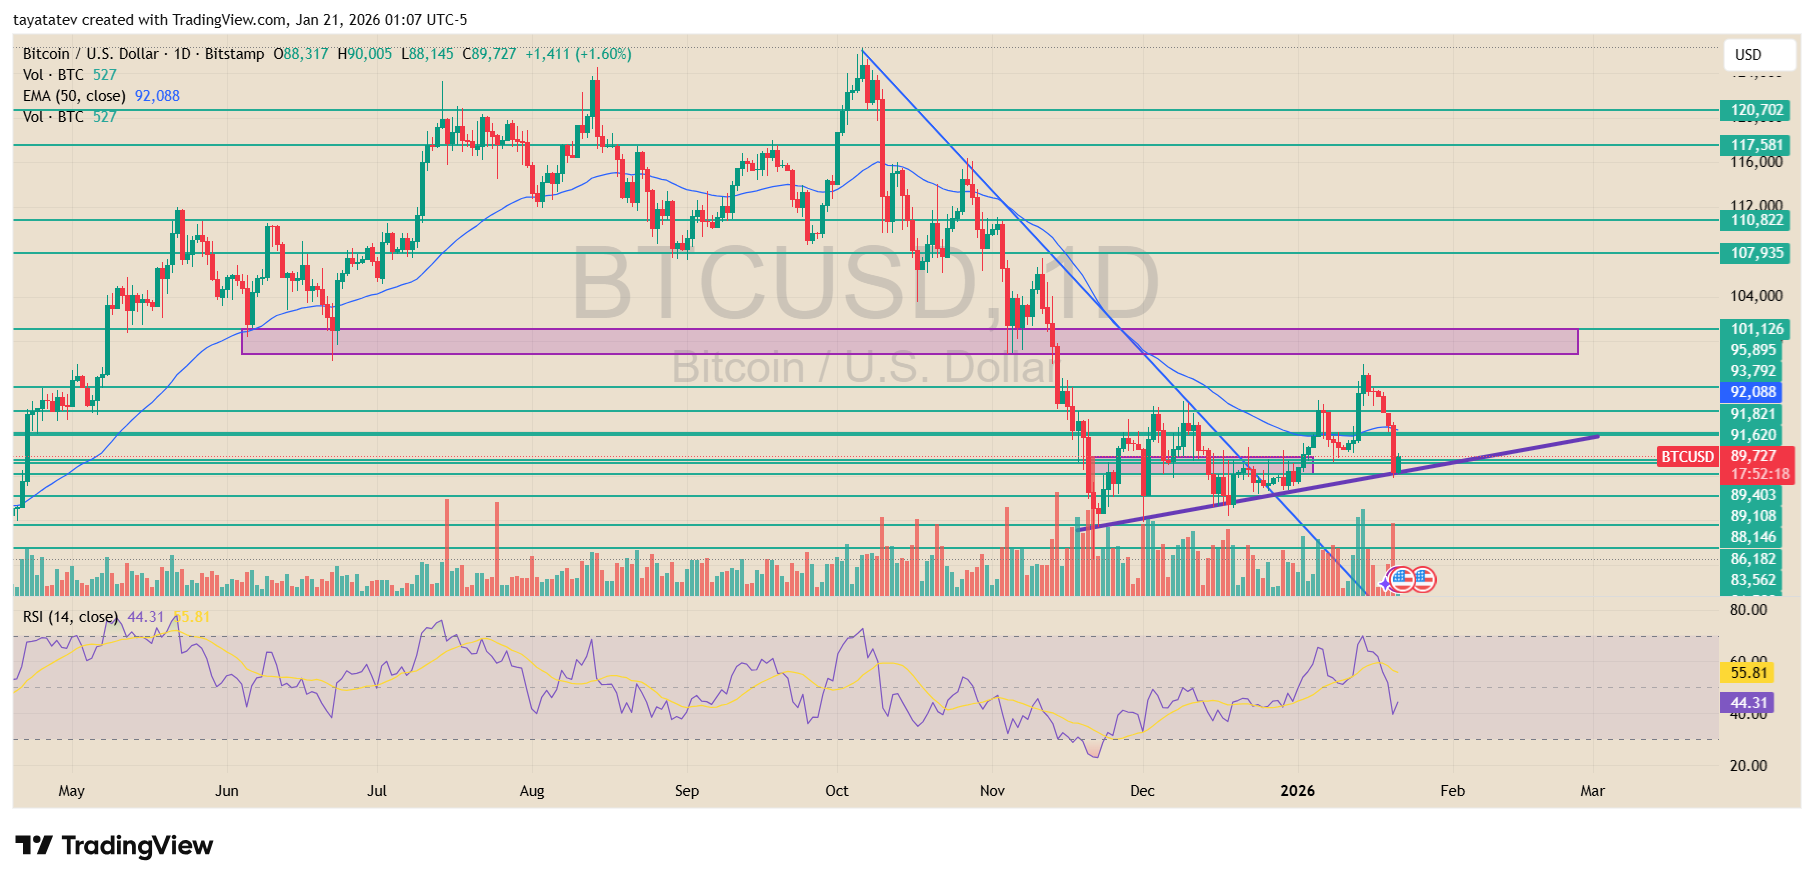
At the same time, the chart shows price holding above a rising support line that has guided trading since December.
That structure limited follow through on the sell off and kept Bitcoin within a broad consolidation range. Volume expanded during the drop, confirming stronger participation, while momentum indicators cooled from recent highs.
Meanwhile, any discussion of a broader reversal still depends on recovery levels. Price would need to climb back into the $95,000 to $101,000 zone, where prior support and resistance overlap, to shift the daily structure.
That area also aligns with former breakdown levels, making it a key test for trend direction.
Until Bitcoin reclaims that range, the chart reflects consolidation after a corrective move rather than a confirmed trend change.
Price action around the rising support and the mid range levels will continue to define near term structure.
Bitcoin Chart Shows Breakdown Below Key Fib Levels
Veteran trader Matthew Dixon said he expects further downside for Bitcoin and broader crypto markets, linking his view to an upcoming interest rate decision due in about a week and to continued volatility risk from political tensions.
Dixon posted the comment on X while sharing a four hour Bitcoin chart that shows price rolling over after a mid January push into the $95,000 to $98,000 region.
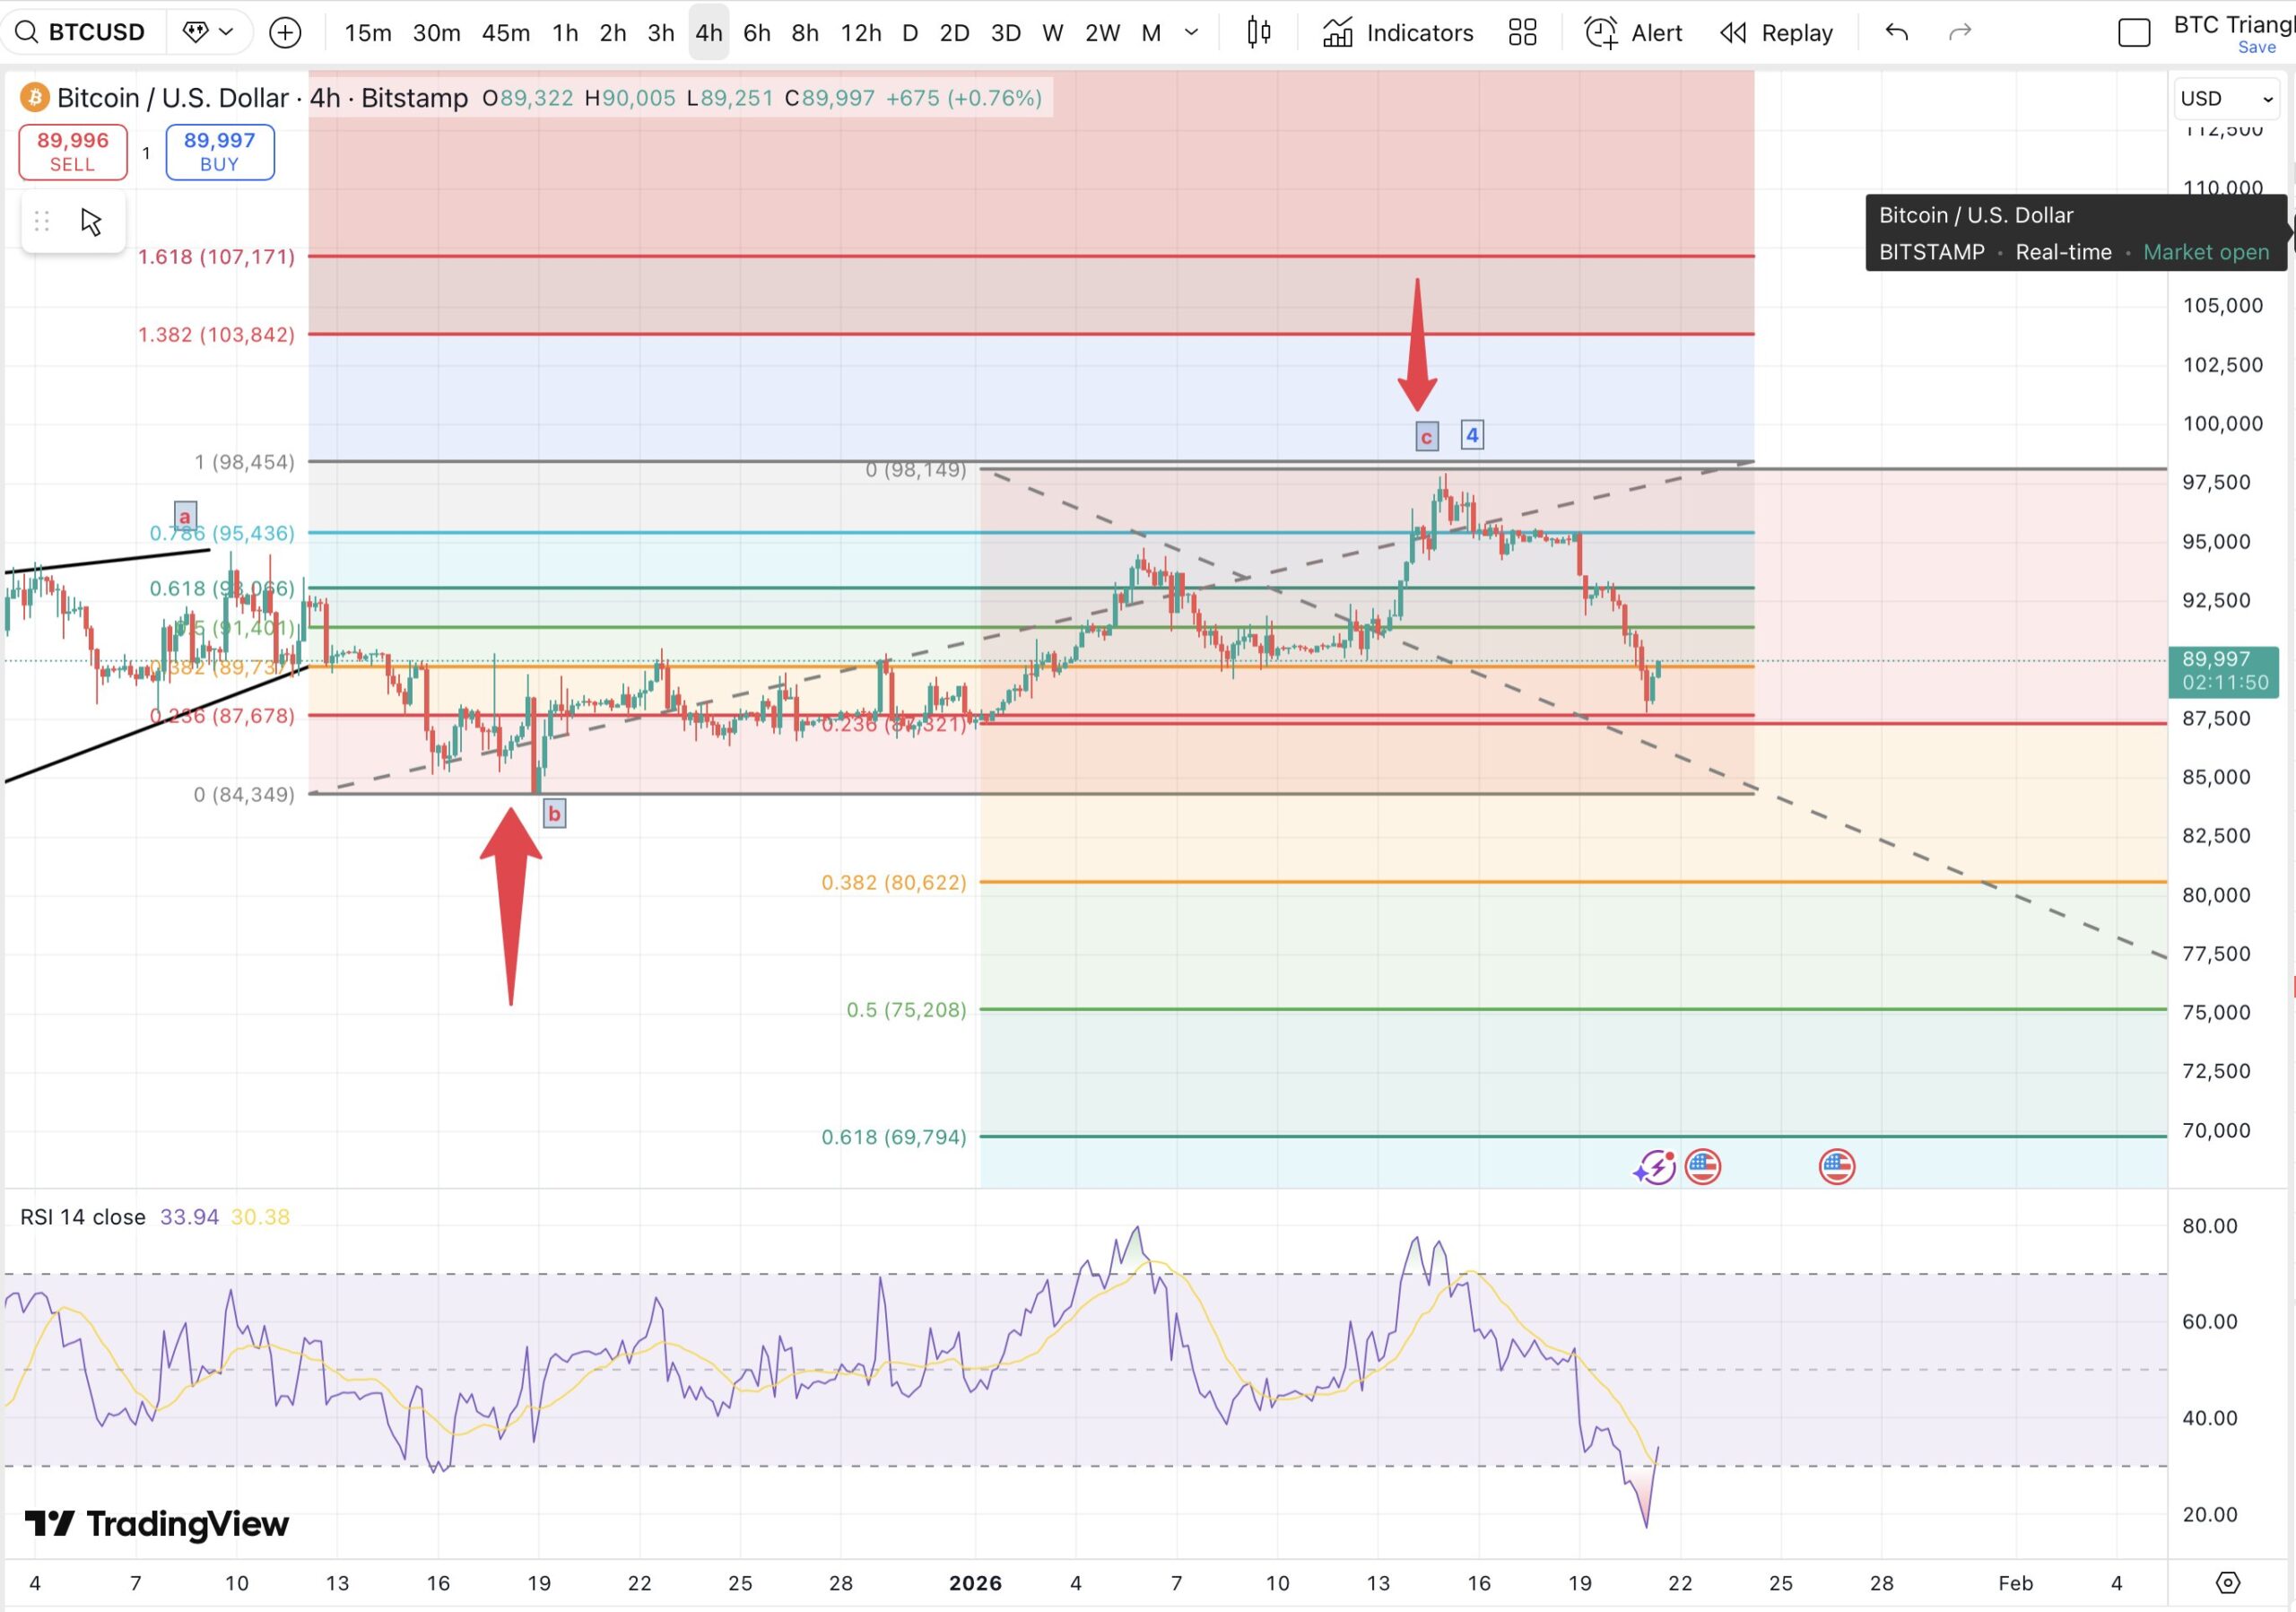
On the chart, Bitcoin topped near the 1.0 extension zone around $98,454 before turning lower, and it then slipped under the $95,436 and $93,066 Fibonacci lines.
That breakdown shifted focus to lower supports, with the next marked levels sitting near $91,140 and $89,730, followed by a deeper support band around $87,678.
The same setup also shows a declining channel drawn with dashed trendlines, with price moving back toward the lower half of that structure after the rejection near resistance.
Meanwhile, the RSI on the four hour view dropped into the low 30s, which showed weakening momentum during the selloff rather than renewed strength.
Dixon framed the next catalyst as the interest rate decision, saying it could set direction depending on expectations.
However, his post also emphasized volatility risk if macro headlines stay noisy, which aligns with the chart’s shift from a recovery attempt into a lower high and a renewed breakdown through nearby support levels.
Disclosure:This article does not contain investment advice or recommendations. Every investment and trading move involves risk, and readers should conduct their own research when making a decision.
Kriptoworld.com accepts no liability for any errors in the articles or for any financial loss resulting from incorrect information.

Tatevik Avetisyan is an editor at Kriptoworld who covers emerging crypto trends, blockchain innovation, and altcoin developments. She is passionate about breaking down complex stories for a global audience and making digital finance more accessible.
📅 Published: January 21, 2026 • 🕓 Last updated: January 21, 2026
