


Ethereum traded near $2,817 against USDT on a TradingView chart shared by X user CryptoKaleo, as the token pressed into a marked support band around the high $2,700s to low $2,800s.
The snapshot shows ETH meeting a long, downward sloping trendline that has capped rallies since the autumn peak, while price action into early 2026 formed lower highs into that descending boundary.
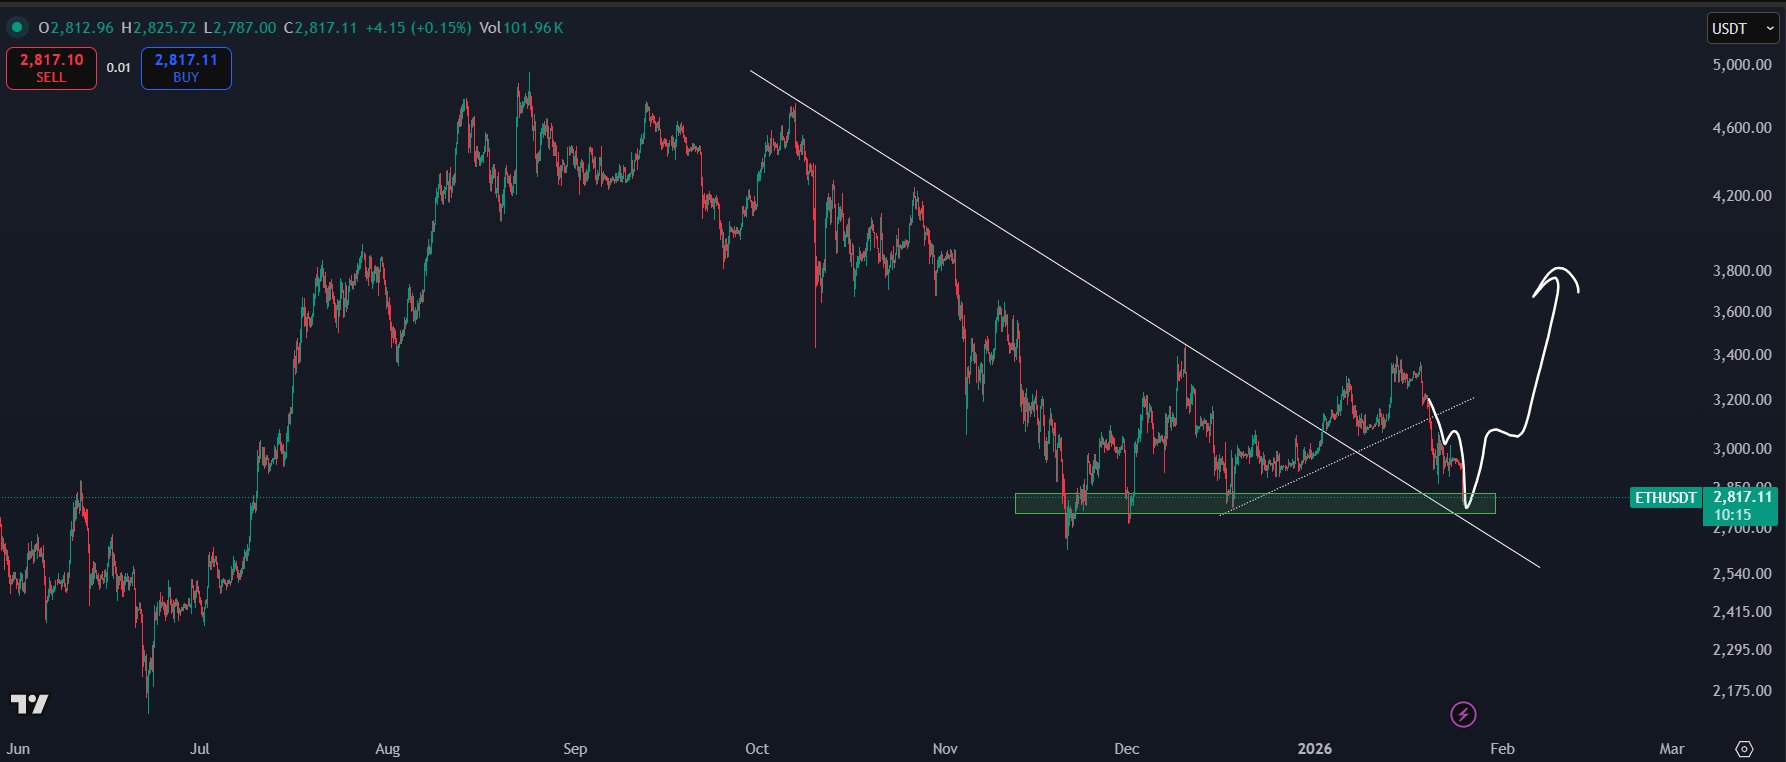
The chart also highlights a smaller rising guide line that supported a gradual climb from late 2025 into January.
Price later slipped back under that shorter uptrend and rotated down toward the green support box, where multiple prior wicks and rebounds cluster, signaling heavy two way trading in the same area.
On the right side, a white projected path sketched on the chart maps a brief breakdown into the support zone, followed by a sharp rebound and a stair step move higher.
The projection points toward a recovery into the low to mid $3,000s first, then extends upward toward the upper $3,000s, implying a trend change only if ETH reclaims the descending resistance and holds above it.
CryptoKaleo captioned the post, “Ethereum / $ETH,” adding, “We’re finally there fellas. The worst is over.”
The comment frames the current test as a potential capitulation style flush into support, while the drawn setup centers on whether the long downtrend line flips from resistance into support during any rebound.
More Crypto Online maps ETH bounce below $3,310, then deeper wave C risk
The daily ETH USD chart shared by More Crypto Online outlines an Elliott Wave correction extending into 2026, with the analyst saying Ethereum is “following our script nicely.”
According to the post, the preferred “yellow scenario” remains valid as long as price stays below $3,310.
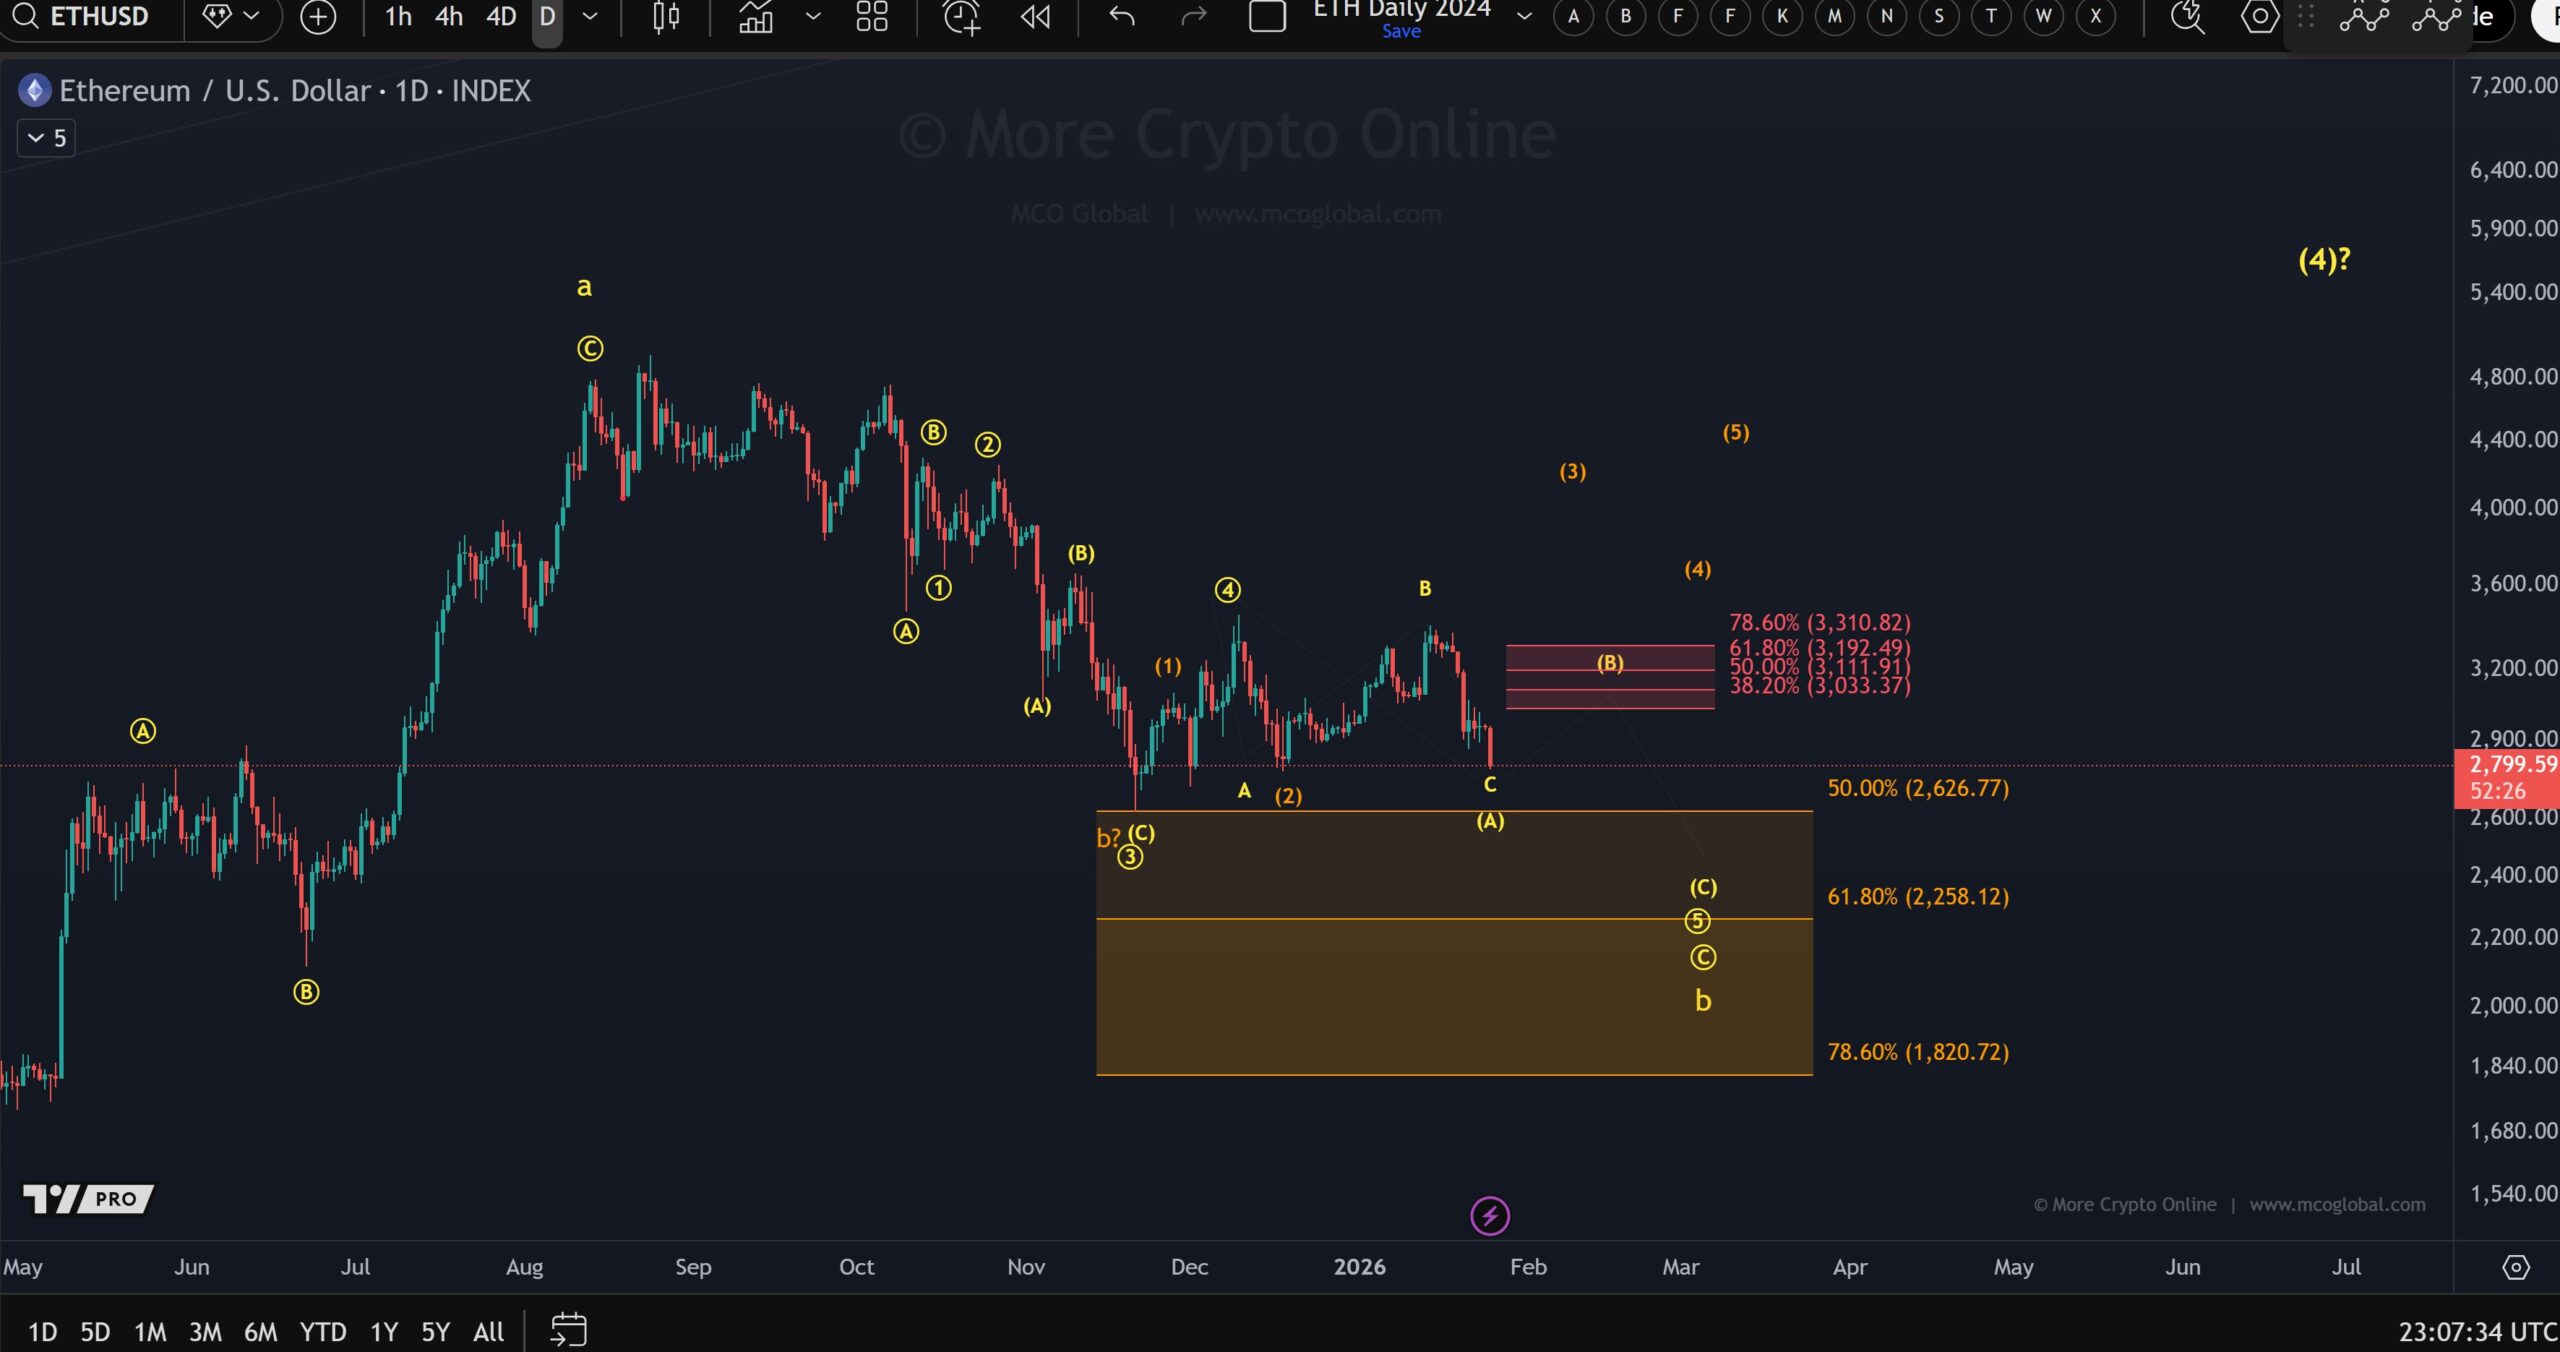
The chart highlights a rebound zone between roughly $3,033 and $3,311, marked by key Fibonacci retracement levels at 38.2% ($3,033), 50% ($3,112), 61.8% ($3,192), and 78.6% ($3,311).
These levels define the area where any countertrend bounce would still fit within a broader corrective structure rather than signal a full trend reversal.
On the downside, the image shows a wide target band for the next leg lower. The 50% retracement sits near $2,626, while the 61.8% level is marked around $2,258.
More Crypto Online said a bounce in wave B is expected first, followed by a larger decline in wave C of circled wave 5, with $2,250 noted as the ideal target.
A deeper reference level appears near the 78.6% retracement around $1,821 if downside pressure extends further.
Disclosure:This article does not contain investment advice or recommendations. Every investment and trading move involves risk, and readers should conduct their own research when making a decision.
Kriptoworld.com accepts no liability for any errors in the articles or for any financial loss resulting from incorrect information.

Tatevik Avetisyan is an editor at Kriptoworld who covers emerging crypto trends, blockchain innovation, and altcoin developments. She is passionate about breaking down complex stories for a global audience and making digital finance more accessible.
📅 Published: January 26, 2026 • 🕓 Last updated: January 26, 2026
