


Dogecoin traded higher over the past several sessions after a sharp mid-January sell-off pushed the price toward the low-$0.12 area, according to the 4-hour DOGE/USD chart on Coinbase.
Price stabilized near $0.115–$0.12, then rebounded toward $0.125 as selling pressure eased and short-term buyers stepped in.
Stay ahead in the crypto world – follow us on X for the latest updates, insights, and trends!🚀
The bounce followed a clear breakdown earlier in the month, when DOGE fell below its 50-period exponential moving average and extended losses from the $0.14–$0.15 zone.
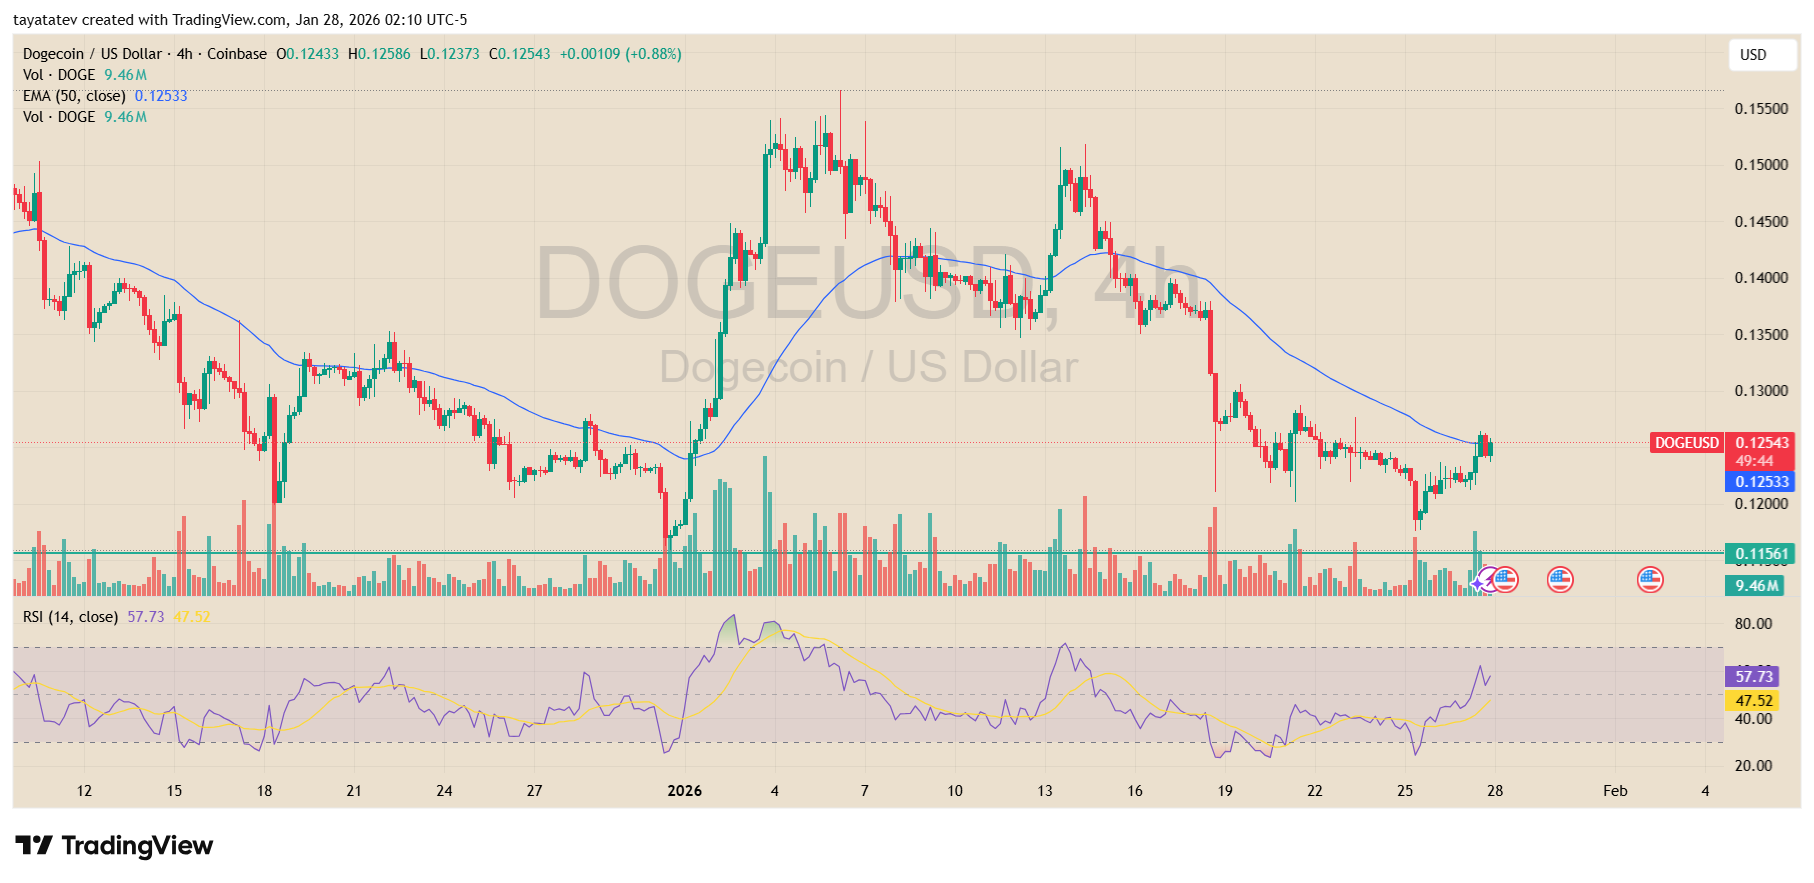
During the decline, momentum weakened but did not collapse. The RSI held above deeply oversold levels and has since climbed toward the high-50s, signaling improving short-term strength.
At the same time, volume expanded on the rebound from local lows, suggesting renewed participation after the capitulation phase.
Price now trades near the 50-EMA, which has turned into immediate resistance after acting as support earlier in January.
Over the last few days, DOGE printed higher lows from the $0.12 region, indicating a short-term base.
However, the structure still reflects a recovery attempt rather than a confirmed trend change.
The prior breakdown zone between $0.13 and $0.135 remains technically important, as it marks the area where sellers previously regained control.
A move back to at least $0.13 would signal that price has reclaimed a key level and would help confirm that the recent bounce is evolving into a broader reversal, rather than another lower-high within the downtrend.
Until that level is cleared, the chart shows DOGE in a repair phase after a steep drop. Below, the $0.12 area continues to act as near-term support, while failure to hold it would reopen downside risk toward the mid-$0.11 range.
For now, price action reflects a market attempting to turn after heavy selling, with confirmation dependent on whether Dogecoin can extend the rebound and hold above $0.13 in the sessions ahead.
Dogecoin consolidates on daily support after liquidity sweep
Dogecoin is trading sideways after sweeping prior lows, with price action compressing around a key daily support zone, according to a 1-day DOGE/USDT chart from Binance.
The consolidation follows a prolonged downtrend that began after the token failed to hold gains from its late-summer rally, which previously carried DOGE toward the $0.25–$0.30 region.
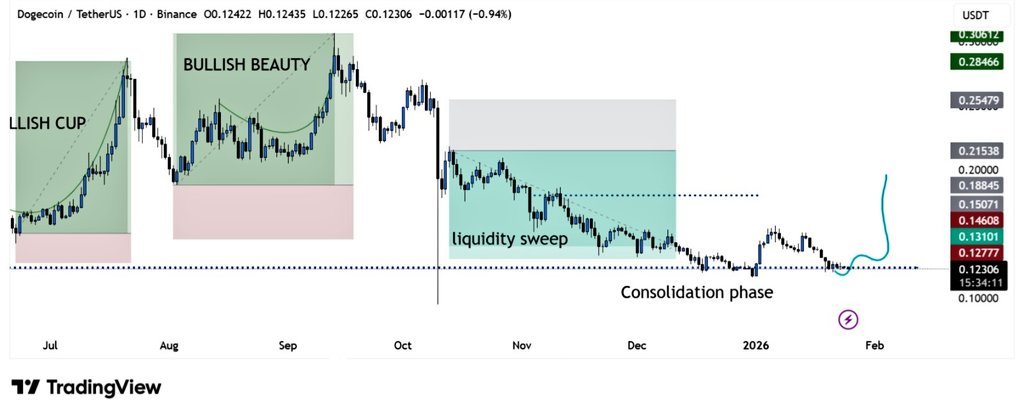
Earlier price structures show a series of bullish formations during July through September, when Dogecoin staged strong advances before topping out.
That phase ended with a sharp reversal in October, as price broke lower and triggered a broad liquidity sweep.
The move flushed long positions and accelerated selling, pushing DOGE into a steady decline through November and December.
Since then, downside momentum has slowed. Price has stabilized near the $0.12–$0.13 area, where repeated daily closes show buyers stepping in to defend the level.
The current range reflects reduced volatility compared with the earlier sell-off, signaling a pause rather than continuation.
This type of compression often appears after a liquidity sweep, as the market reassesses value following forced exits.
While Dogecoin remains below former resistance zones near $0.15 and $0.18, the structure has shifted from impulsive selling to range-bound trading.
For now, the chart shows consolidation on support rather than a confirmed trend change.
The next directional move will depend on whether buyers continue to hold the current base or sellers regain control below recent lows.
Disclosure:This article does not contain investment advice or recommendations. Every investment and trading move involves risk, and readers should conduct their own research when making a decision.
Kriptoworld.com accepts no liability for any errors in the articles or for any financial loss resulting from incorrect information.

Tatevik Avetisyan is an editor at Kriptoworld who covers emerging crypto trends, blockchain innovation, and altcoin developments. She is passionate about breaking down complex stories for a global audience and making digital finance more accessible.
📅 Published: January 28, 2026 • 🕓 Last updated: January 28, 2026
