


Ethereum fell sharply over the weekend, extending its broader downtrend and breaking below several technical levels on the daily chart.
On the Bitstamp feed, ETH dropped to around $2,205 by early Monday after trading near the $2,900–$3,000 range late last week.
Stay ahead in the crypto world – follow us on X for the latest updates, insights, and trends!🚀
The move marked a clear shift in momentum, with sellers regaining control as price closed well below prior consolidation zones.
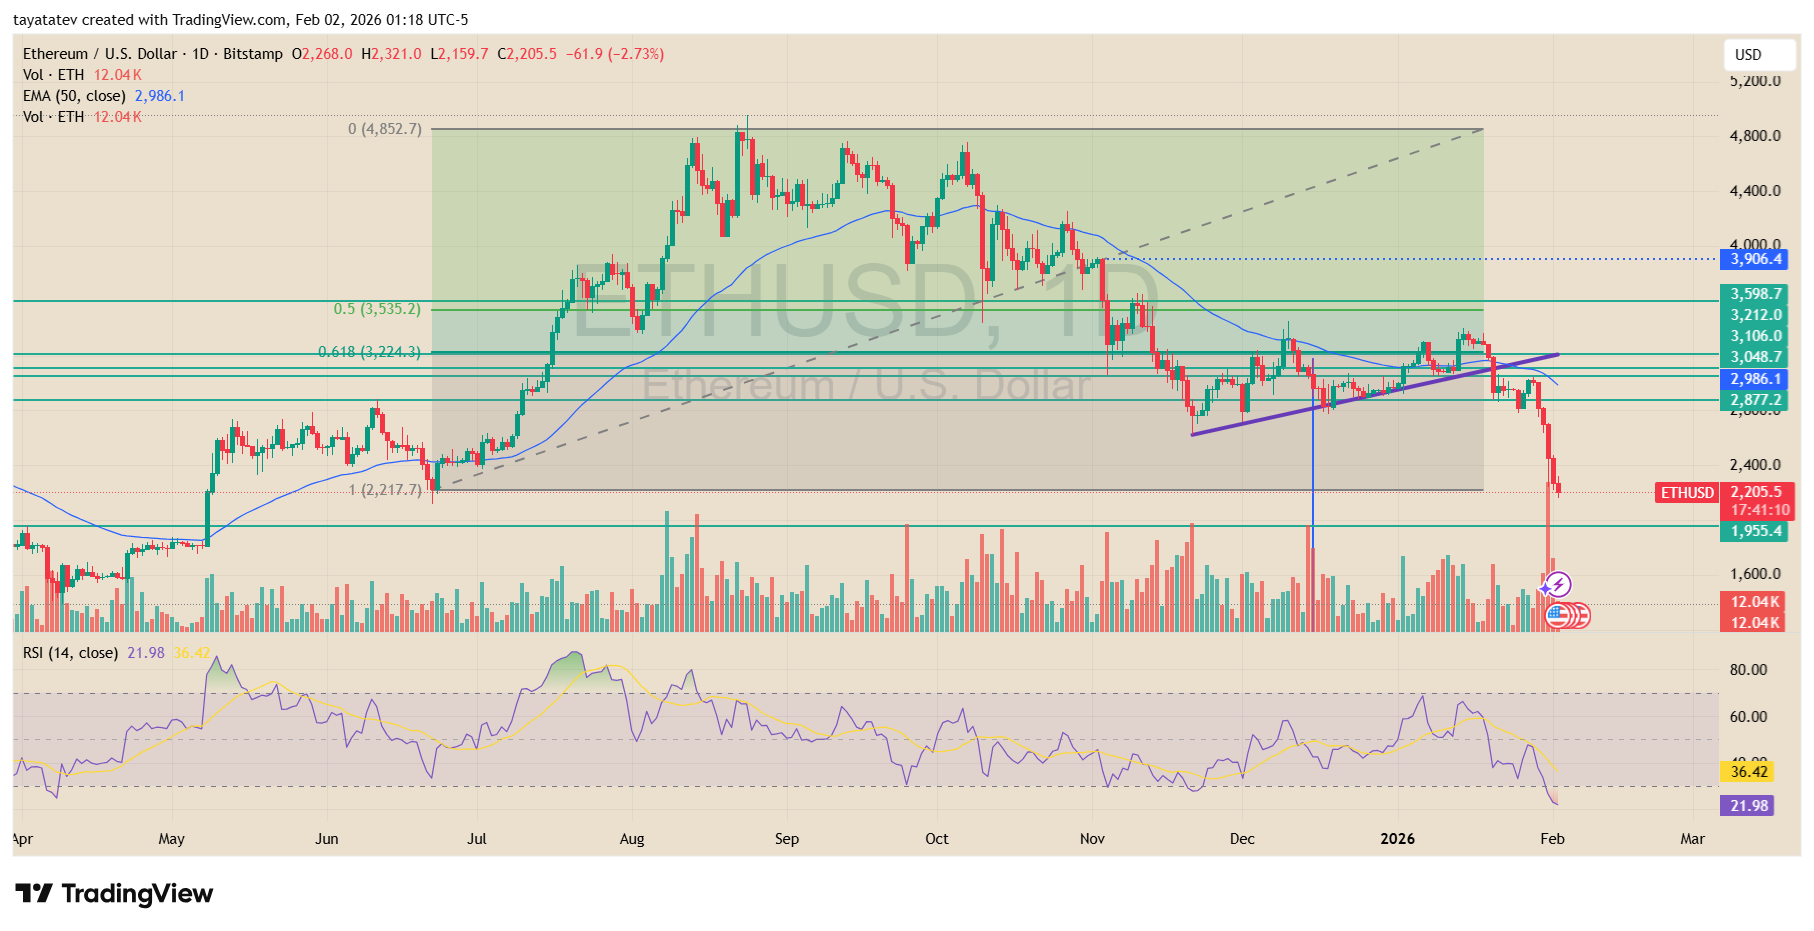
The decline developed gradually on Saturday and intensified on Sunday. Ethereum first slipped below the $3,050–$3,000 area, where price had been compressing along a rising short-term trendline. Once that structure failed, selling pressure increased quickly.
By Sunday, ETH broke through support near $2,870 and $2,600, triggering a fast move lower with limited buying response during weekend trading.
Technically, the breakdown confirmed a continuation of the corrective phase that began after Ethereum failed to sustain moves above the $3,900–$4,000 region earlier in the cycle.
Price also moved decisively below the 50-day exponential moving average, which had already turned into resistance during recent rebound attempts. Volume expanded on the selloff, pointing to active distribution rather than a low-liquidity dip.
Momentum indicators reflected the speed of the move. The daily RSI fell toward the low-20s, signaling deeply oversold conditions as downside pressure intensified.
While such readings can appear near short-term exhaustion points, they also underline how one-sided weekend flows became, with sellers dominating price action.
By early Monday, Ethereum hovered near $2,200, sitting just above the next visible support zone around $2,000.
The weekend drop left ETH technically stretched and structurally weaker, with former support levels now acting as resistance if price attempts a recovery.
Stay ahead in the crypto world – follow us on X for the latest updates, insights, and trends!🚀
Ethereum Liquidity Heatmap Shows Heavy Interest Near $2,100
A liquidity heatmap shared by Osemka points to a large concentration of resting liquidity around $2,100 for Ethereum, marking it as a key zone after the latest selloff.
The chart shows the brightest band clustered near that level, which typically signals stacked limit orders and liquidation levels that can attract price during fast moves.
Ethereum’s recent drop pushed price back toward the low-$2,000s after weeks of softer trading above $3,000.
As price slid, the heatmap suggests market interest thickens near $2,100, which can act like a magnet in the short term as traders position around a clear reference level.
If ETH holds above that area, the same zone can become a pivot where bids absorb selling and slow momentum.
However, if price trades into the band and fails to stabilize, the next reaction often depends on whether liquidity below it remains thin or starts to rebuild, which can change how quickly price moves through the range.
Disclosure:This article does not contain investment advice or recommendations. Every investment and trading move involves risk, and readers should conduct their own research when making a decision.
Kriptoworld.com accepts no liability for any errors in the articles or for any financial loss resulting from incorrect information.

Tatevik Avetisyan is an editor at Kriptoworld who covers emerging crypto trends, blockchain innovation, and altcoin developments. She is passionate about breaking down complex stories for a global audience and making digital finance more accessible.
📅 Published: February 2, 2026 • 🕓 Last updated: February 2, 2026
