


XRP has traded in a sustained downtrend for months, as sellers controlled the daily chart and kept price below a falling trendline and the 50-day EMA.
The token recently slid into the $1.35–$1.16 demand zone, where buyers stepped in and slowed the decline.
Stay ahead in the crypto world – follow us on X for the latest updates, insights, and trends!🚀
Since then, price has stabilized near $1.48, with small daily gains forming after the latest selloff. This shift marks the first clear pause in the broader downtrend since late 2025.
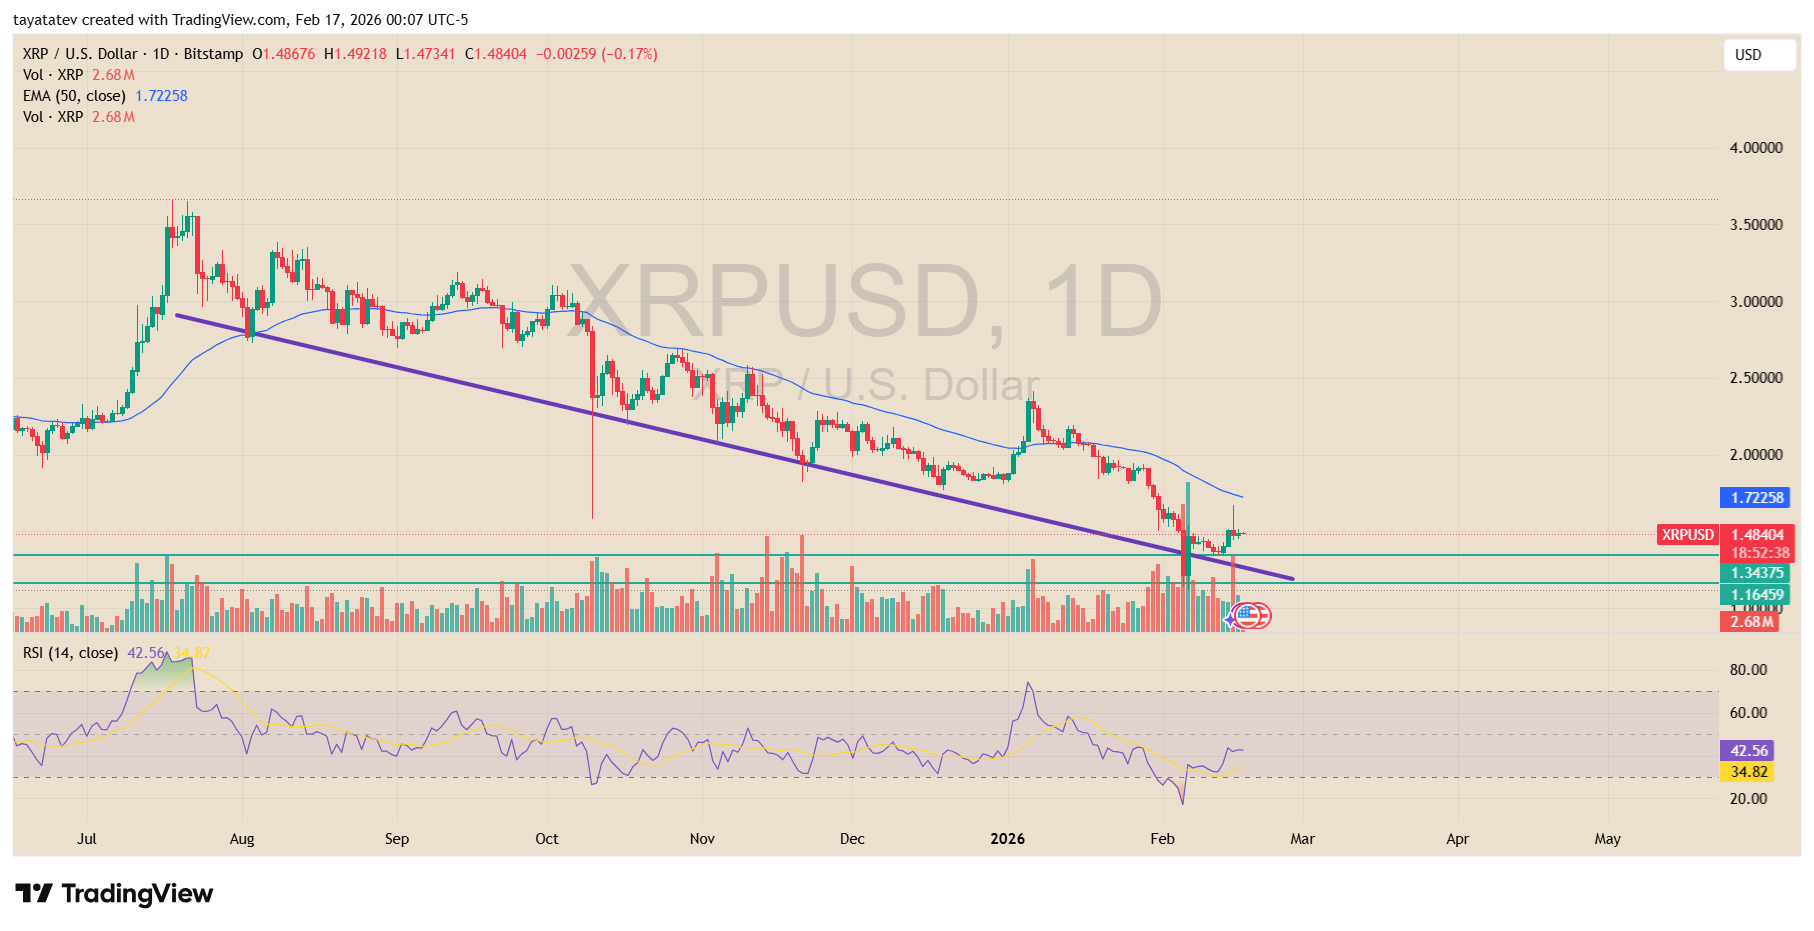
Momentum indicators show early improvement but stop short of a confirmed trend change. The daily RSI has rebounded from oversold levels and now sits in the low 40s, which signals easing sell pressure rather than strong upside momentum.
At the same time, volume picked up during the recent bounce, which shows active participation from buyers at support.
However, XRP still trades below the 50-day EMA, so sellers retain control of the higher time frame trend.
For confirmation, XRP needs a clean push toward the $2.50 area and then hold above it.
A move through that zone would break the sequence of lower highs and signal that buyers regained control of the daily structure.
Until price reclaims that level and holds above the falling trendline, the rebound remains a counter-trend move inside a broader downtrend.
XRP Liquidation Heatmap Shows Tight Range With Key Liquidity Clusters Overhead
Meanwhile, the liquidation heatmap shows dense liquidity bands stacked above current price around the $1.52–$1.56 zone.
These clusters reflect leveraged short positions that could face forced liquidations if price pushes higher.
As a result, upside moves into that area may trigger fast reactions as stops and liquidations sit close together.
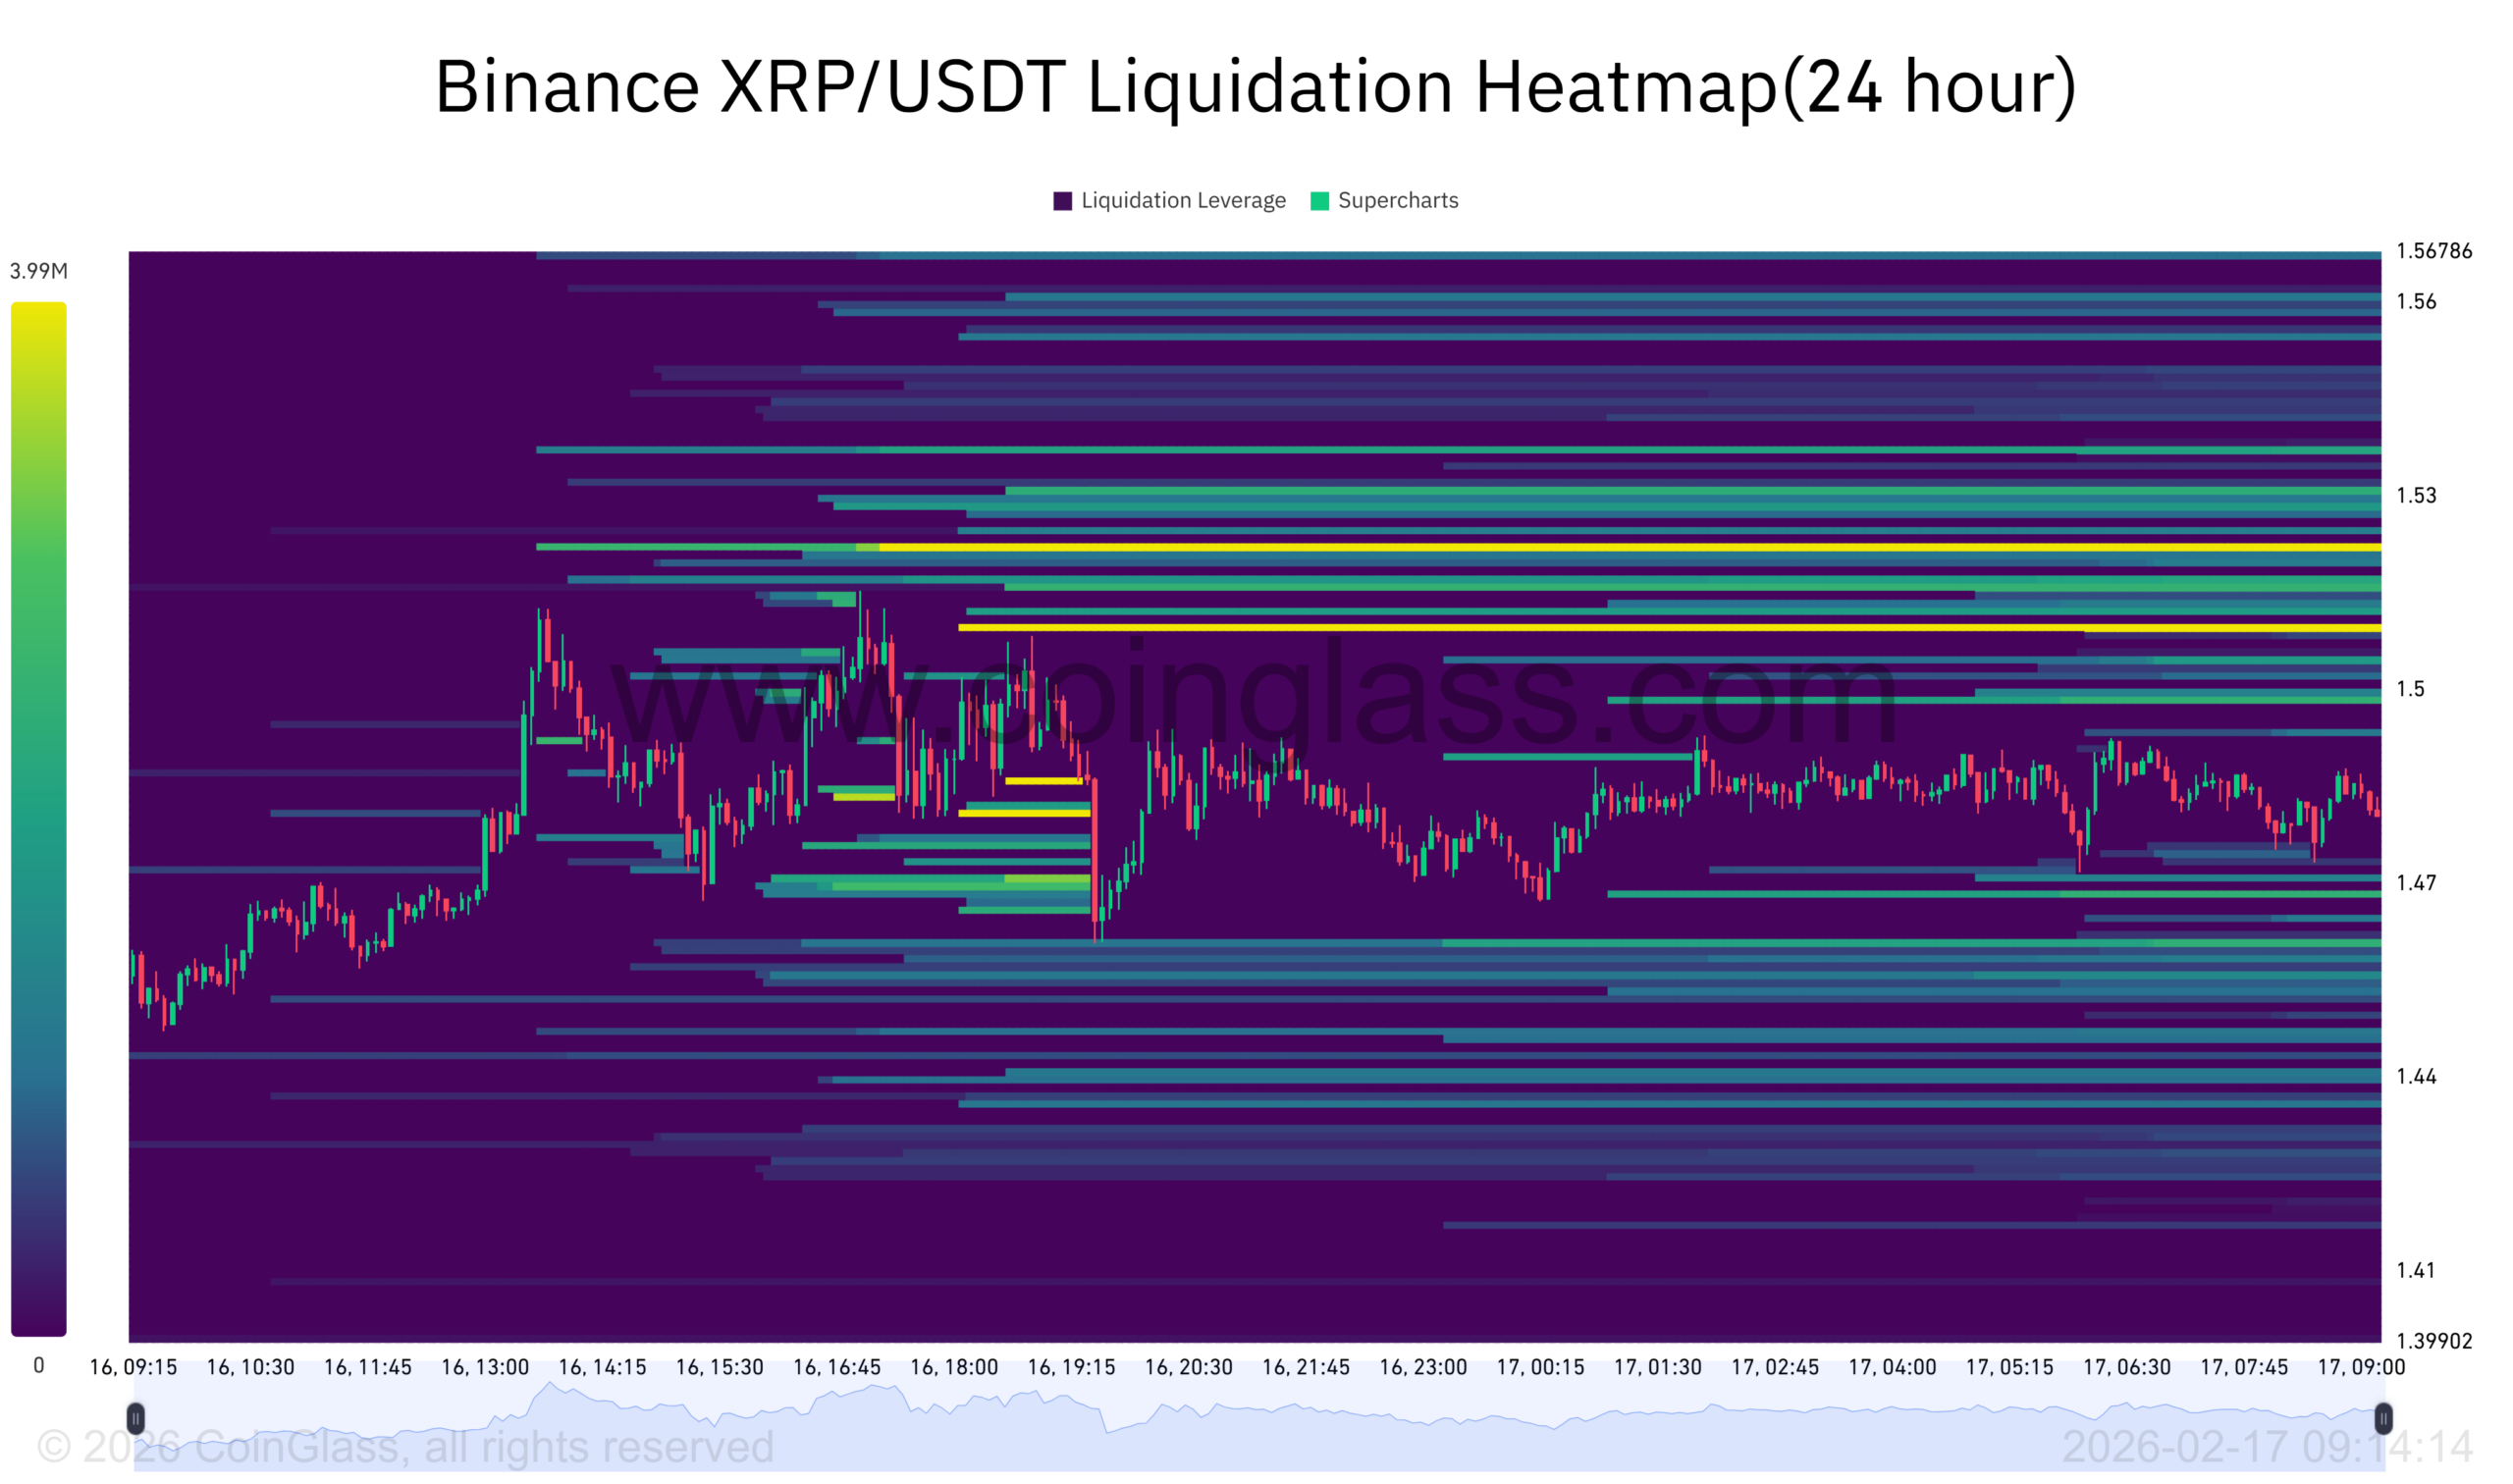
At the same time, thinner liquidity appears below current price, with scattered pockets near the $1.44–$1.41 area.
This structure shows that downside pressure has eased compared with earlier sessions, as fewer large liquidation pools sit directly under spot.
Price action has moved sideways, which suggests traders reduced directional bets after the recent volatility. The market now reflects balance rather than a one-sided push.
This setup fits the broader shift seen on the daily chart, where XRP slowed a long downtrend and started to form a base.
However, liquidity overhead still caps near-term upside. A sustained push into the $1.52–$1.56 zone would signal rising buy pressure and test whether sellers still control that area.
Until price clears those clusters, the market likely remains range-bound with short bursts of volatility around nearby liquidity bands.
Disclosure:This article does not contain investment advice or recommendations. Every investment and trading move involves risk, and readers should conduct their own research when making a decision.
Kriptoworld.com accepts no liability for any errors in the articles or for any financial loss resulting from incorrect information.

Tatevik Avetisyan is an editor at Kriptoworld who covers emerging crypto trends, blockchain innovation, and altcoin developments. She is passionate about breaking down complex stories for a global audience and making digital finance more accessible.
📅 Published: February 17, 2026 • 🕓 Last updated: February 17, 2026
