


Ethereum stayed in a downtrend for several weeks. During this period, price kept making lower highs and lower lows.
In addition, ETH traded below the 50-day EMA, which confirmed ongoing selling pressure.
Stay ahead in the crypto world – follow us on X for the latest updates, insights, and trends!🚀
As a result, sellers controlled the market, and each rebound failed near prior resistance zones around the $3,050–$3,200 area.
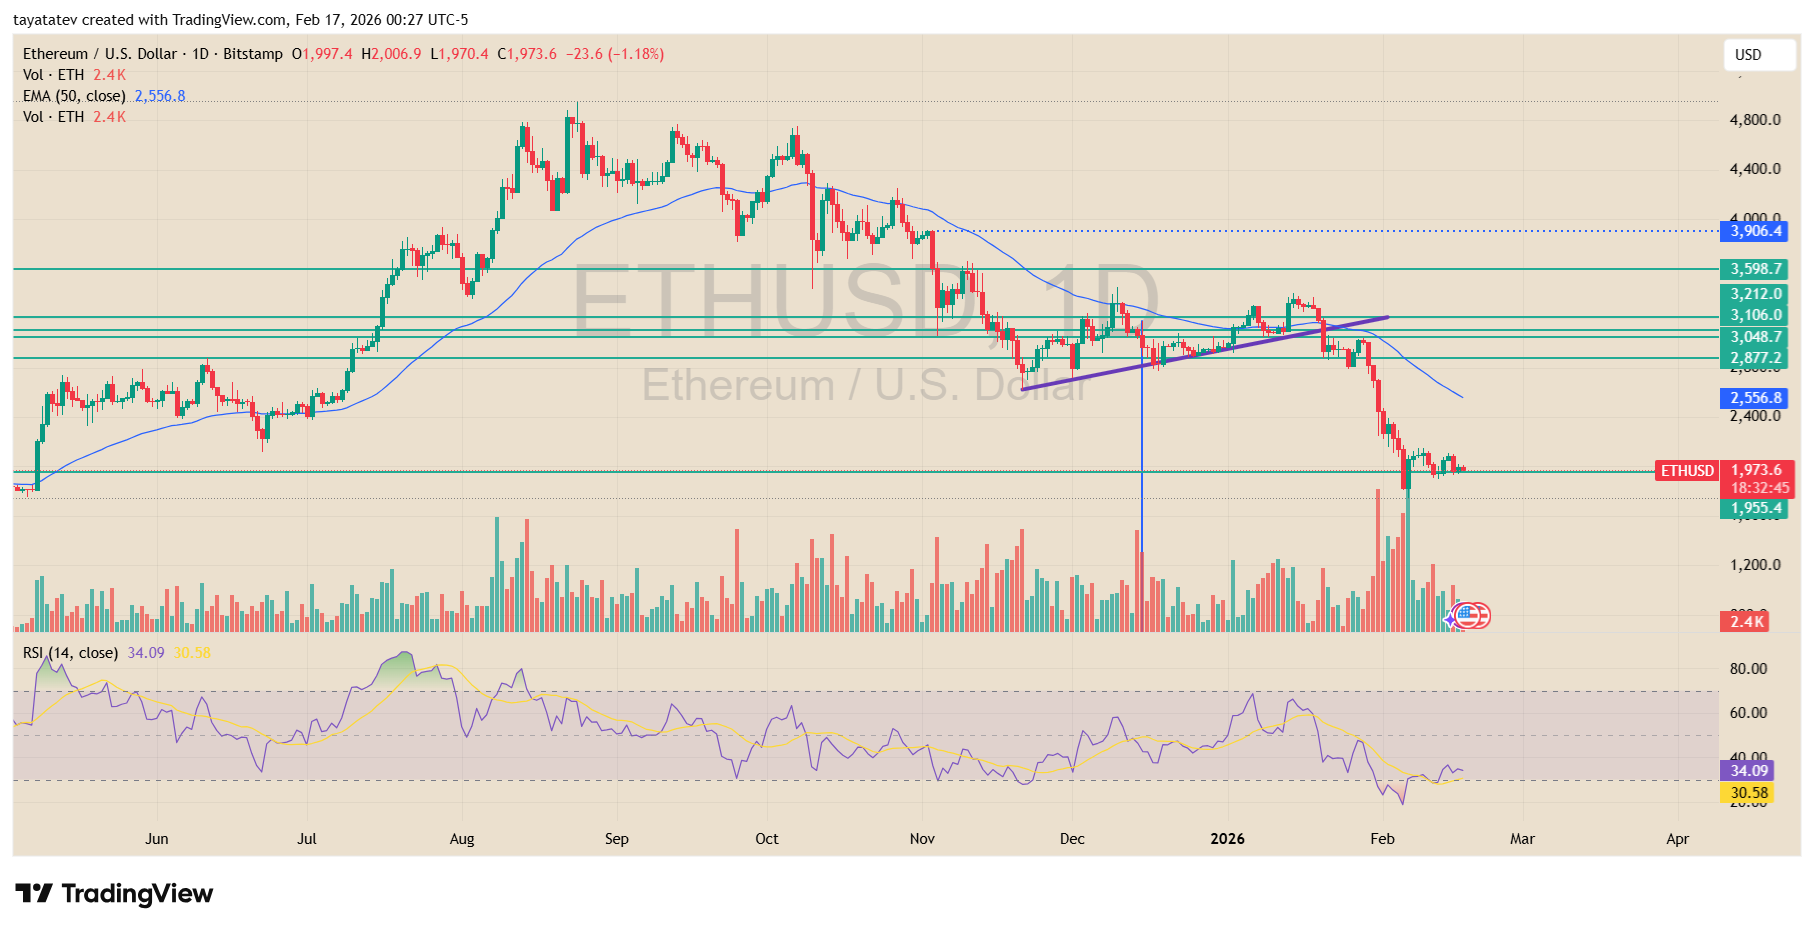
Now, ETH shows early signs of a rebound. Price bounced from the $1,950–$2,000 support zone, and the latest candles show smaller losses after a sharp selloff.
At the same time, RSI moved up from oversold levels, which signals that selling pressure is easing.
Moreover, volume spiked during the drop, then cooled as price stabilized. This shift often appears when forced selling slows and short-term buyers step in.
However, the trend has not changed yet. ETH still trades below the falling 50-day EMA, and the last breakdown came from a rising trendline that acted as short-term support. Therefore, the broader structure remains weak.
To confirm a real trend reversal, ETH needs to reclaim and hold above the $2,800 zone. That level aligns with prior support turned resistance and sits near the broken structure.
If price fails to reach and hold above $2,800, the move stays a relief bounce inside a downtrend.
ETH Liquidity Map Shows Upside Targets if $2,150 Breaks
Ethereum stayed under pressure in recent sessions, and the price line on the heatmap trends lower into early February.
Still, the chart shows thick liquidity bands sitting above spot, which often act like magnets when price rebounds.
In this view, the brightest zones cluster higher than current price, especially after ETH dipped and then tried to stabilize.
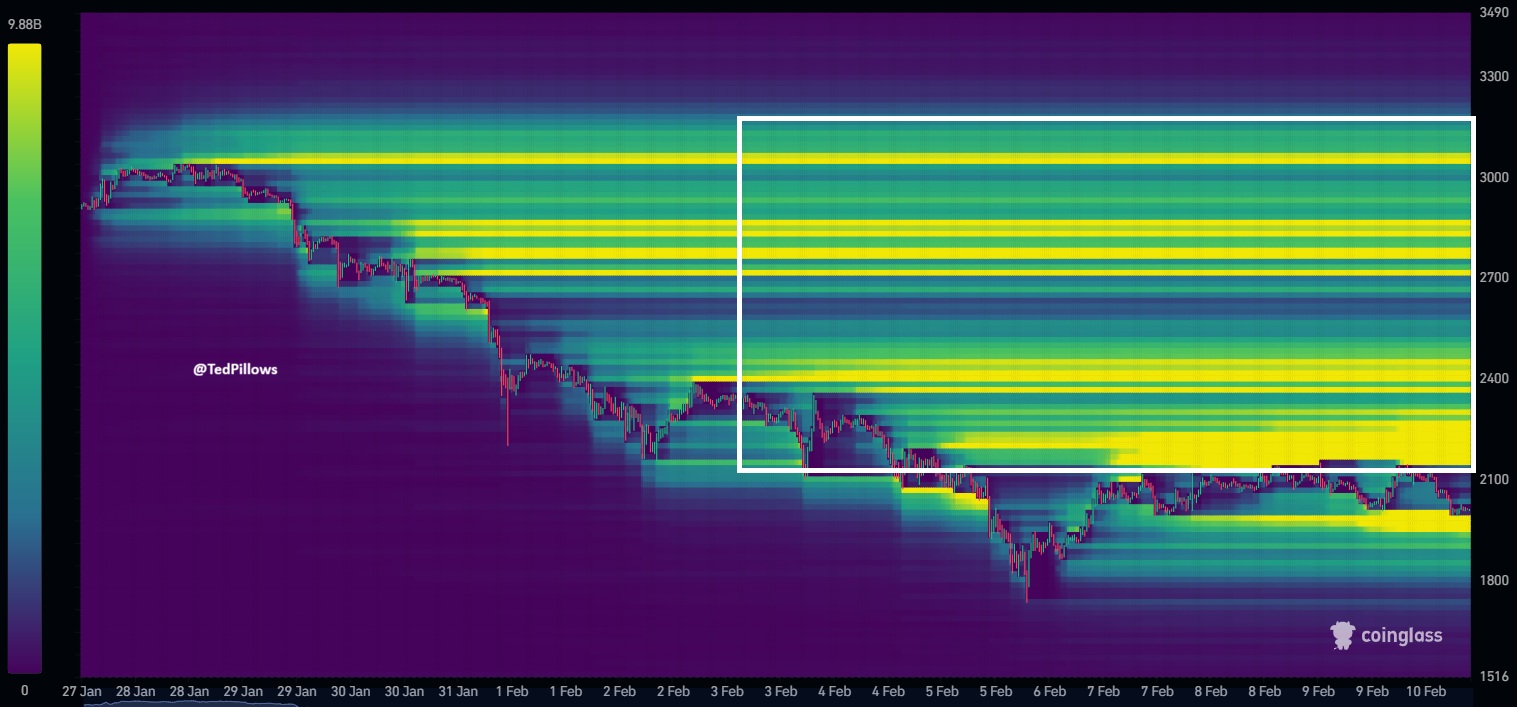
The biggest upside liquidity pocket sits between $2,200 and $2,400. That band looks dense and wide, which signals a larger concentration of resting orders in that range.
Because of that, ETH could move into that area if buyers reclaim control and push price back through nearby resistance levels.
The key trigger on this setup is $2,150. If ETH reclaims and holds above $2,150, price has a cleaner path toward the $2,200–$2,400 liquidity zone.
If ETH fails to reclaim $2,150, then the upside pull weakens, and price can keep chopping near the lower range instead of expanding higher.
Disclosure:This article does not contain investment advice or recommendations. Every investment and trading move involves risk, and readers should conduct their own research when making a decision.
Kriptoworld.com accepts no liability for any errors in the articles or for any financial loss resulting from incorrect information.

Tatevik Avetisyan is an editor at Kriptoworld who covers emerging crypto trends, blockchain innovation, and altcoin developments. She is passionate about breaking down complex stories for a global audience and making digital finance more accessible.
📅 Published: February 17, 2026 • 🕓 Last updated: February 17, 2026
