

 Stuck Below 112000 Liquidity Says ‘Squeeze Up,’ 2018 Pattern Says ‘November Drop")
Bitcoin briefly fell below the $107,000 support zone but quickly reclaimed it, showing that buyers are still active around that level.
The recovery, however, faces pressure as price now struggles to stay above $110,000. This hesitation signals weak momentum and uncertainty in the short term.
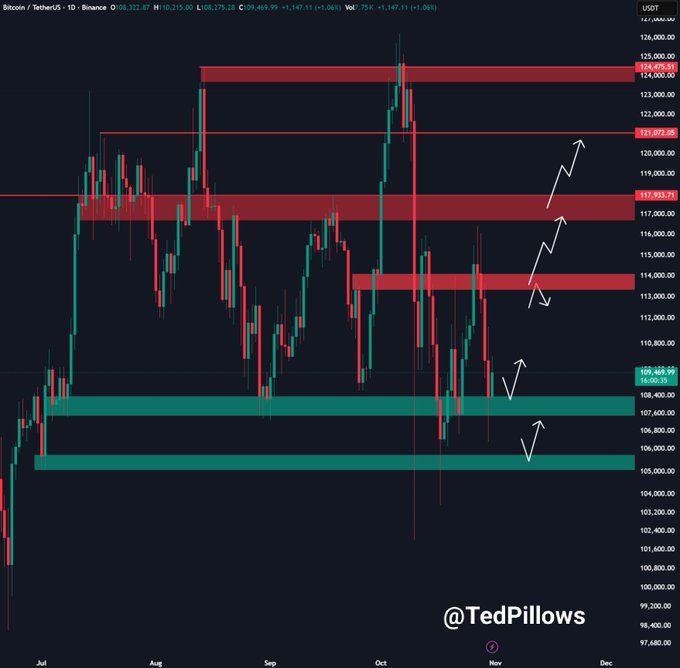
The chart highlights $112,000 as the first key resistance. A clean breakout and daily close above that zone could mark the start of a broader market rebound.
It would also open the path toward the $114,000–$117,000 supply range, where sellers previously dominated.
Beyond that, a push toward $121,000–$124,000 would confirm strength and renew optimism for a medium-term uptrend.
Until Bitcoin reclaims $112,000, its structure remains fragile. Each rejection near the $110,000–$112,000 range adds pressure on the lower support area. If buyers lose control again, price could revisit the $107,000 zone.
A breakdown there would expose the next support pocket between $104,000 and $100,000, where the market could see sharper declines.
Stay ahead in the crypto world – follow us on X for the latest updates, insights, and trends!🚀
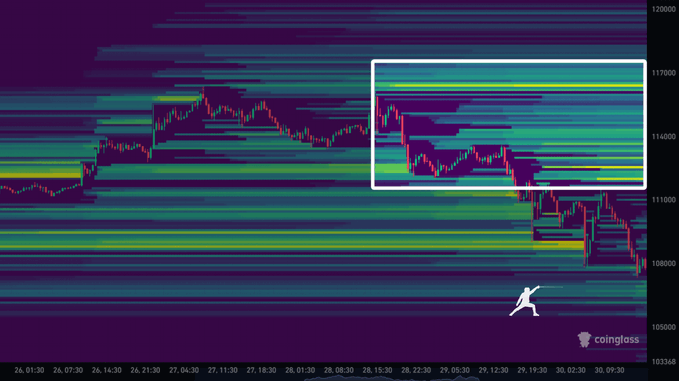
Bitcoin liquidity stacked above spot price
The heatmap shows most resting BTC liquidity above the current trading zone, clustered between roughly $112,000 and $117,000.
That means a single impulsive move higher could run through those limit orders and force-short positions to cover, creating a fast spike.
However, price is still trading below the main liquidity block, so buyers must first trigger that move; until then, the market stays vulnerable to another fade.
A clean push into that upper band would confirm that a V-shaped rebound is in play, but without real buy volume, it remains only a setup, not a confirmed reversal.
Bitcoin’s October dip echoes historic pattern
Bitcoin closed October down about 3.4%, matching the same performance seen in October 2018.
That year, the drop was followed by a steep 36% crash in November, according to Coinglass data.
The repetition of this pattern adds weight to short-term bearish sentiment, especially with price still struggling to stay above key supports.
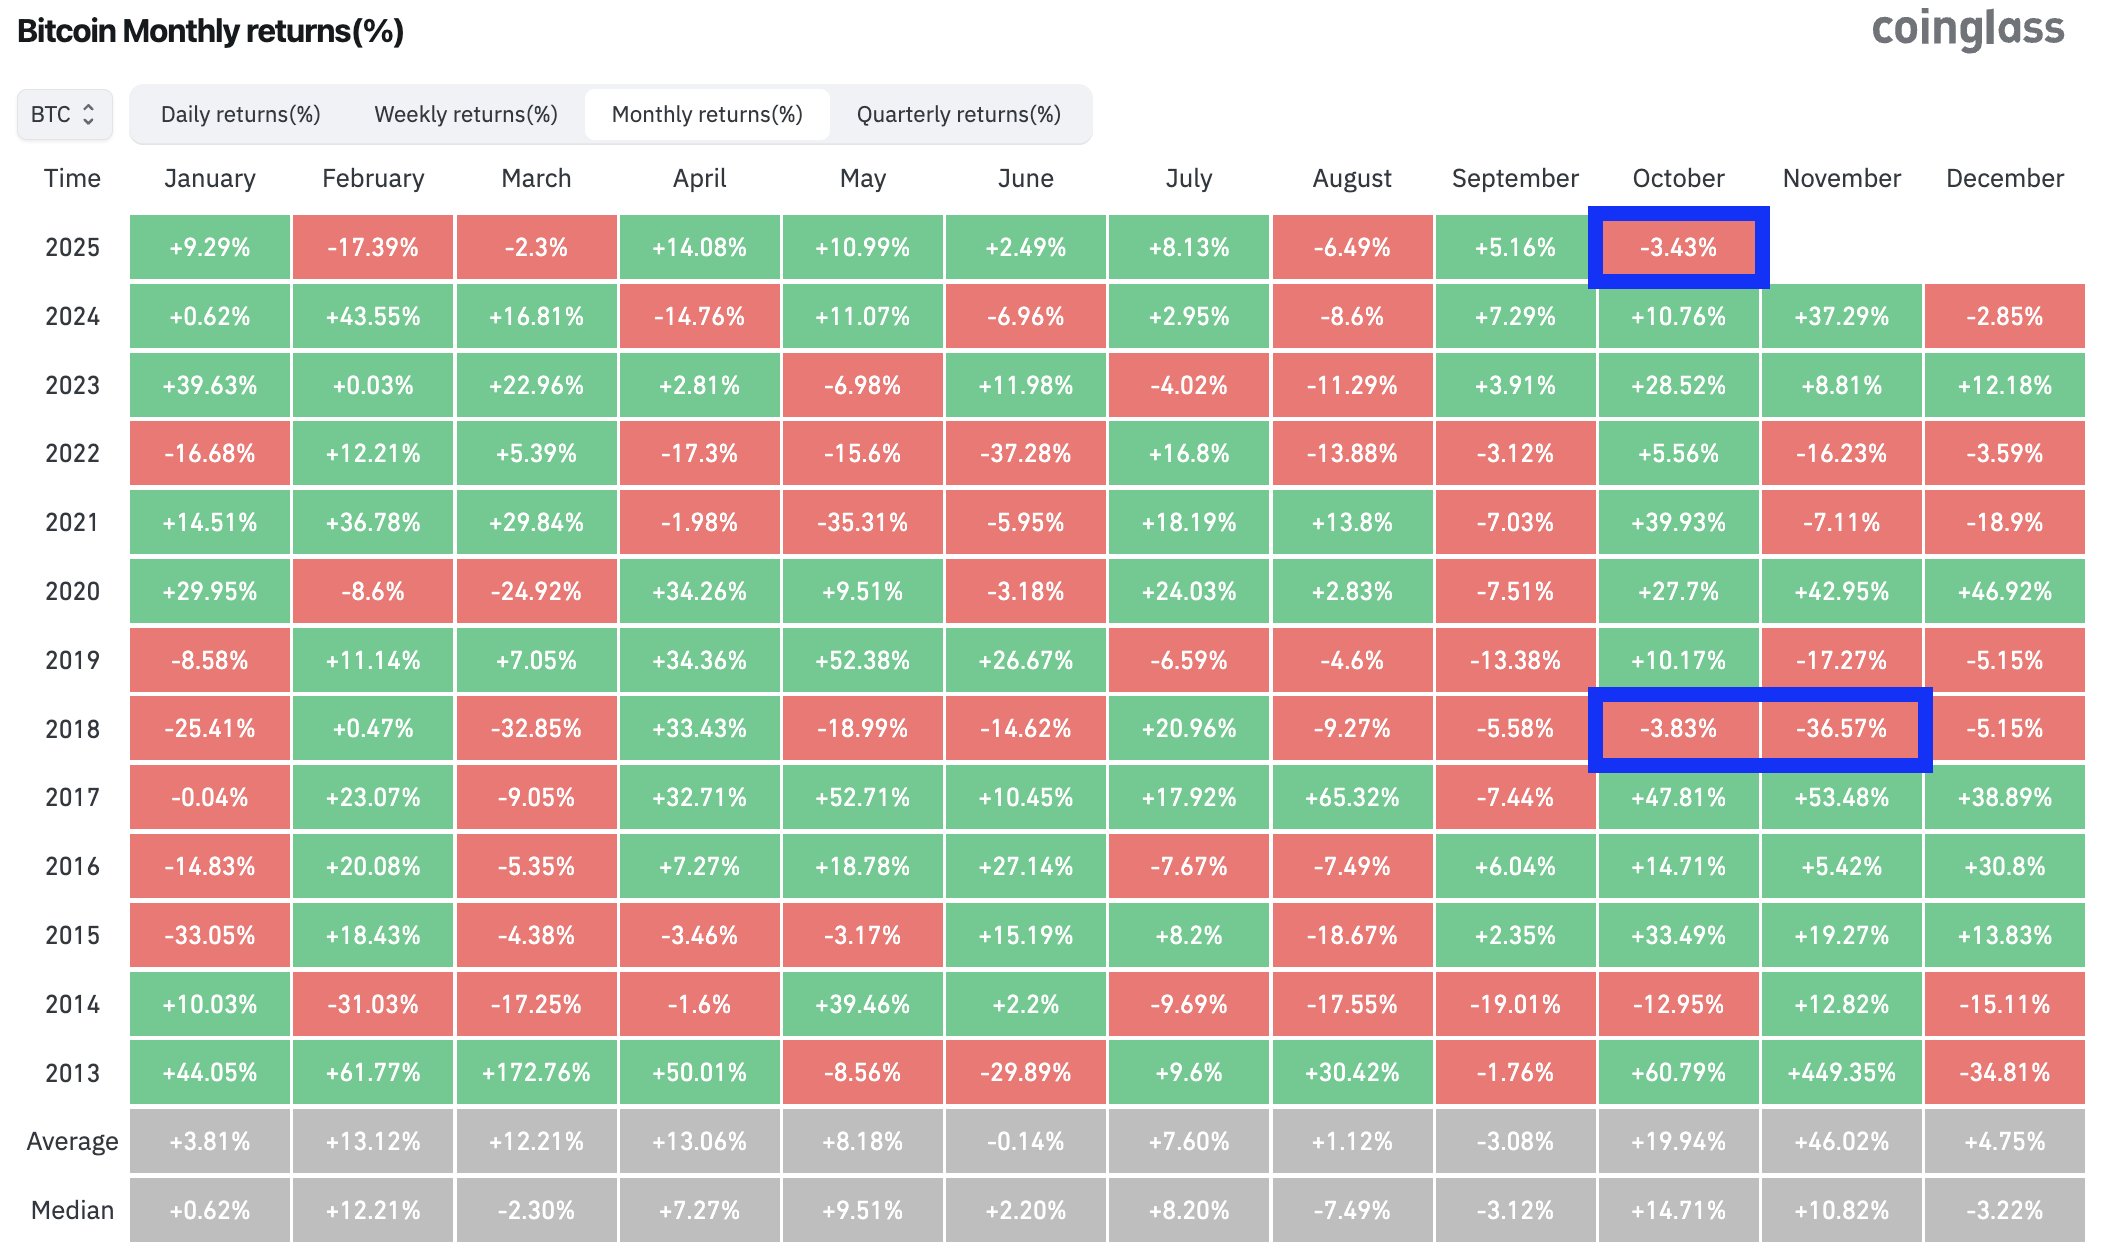
Historically, November tends to be a volatile month for Bitcoin, often amplifying the prior month’s direction. If the current setup repeats the 2018 structure, traders could see heavier downside pressure before any recovery attempt.
However, the presence of ETF-related flows and stronger institutional positioning in 2025 make this cycle slightly different.
Market participants now watch whether Bitcoin can decouple from this historic precedent or if the October slip again marks the start of a deeper correction phase.
Bitcoin trades inside rising channel on Oct. 31, 2025
Bitcoin’s daily chart on Oct. 31, 2025 shows price still moving inside a rising channel that started after the April breakout.
A rising channel is a pattern where price makes higher highs and higher lows inside two parallel lines, showing controlled but steady upside.
BTC is now testing the lower boundary of that channel near $109,000–$110,000, while the upper boundary sits much higher, close to $135,000.
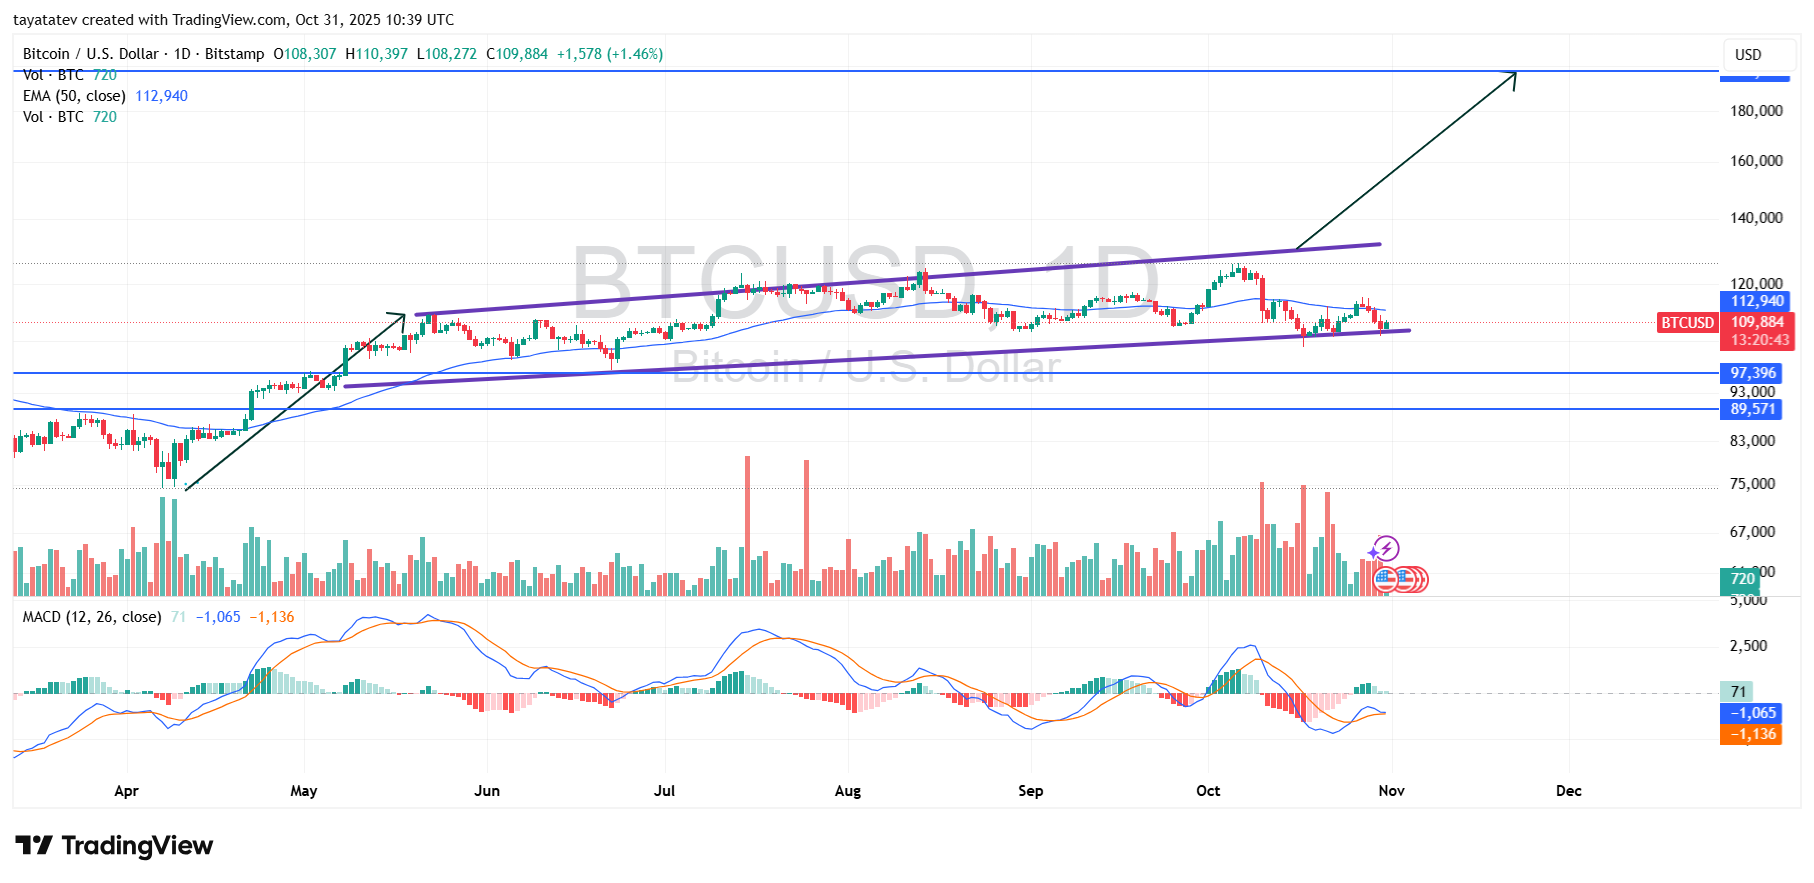
As long as Bitcoin holds this lower trendline and reclaims the 50 day EMA at $112,940, the pattern stays valid and the measured move points to a continuation.
Because the earlier impulse from March to May is being projected from the current support, the structure suggests the next confirmed leg could add about 81% from today’s zone, targeting the long term resistance near $195,000–$200,000 shown on the chart.
Volume remains moderate and MACD is flattening after a down swing, so bulls still need a bounce from the channel floor to activate the move.
Disclosure:This article does not contain investment advice or recommendations. Every investment and trading move involves risk, and readers should conduct their own research when making a decision.
Kriptoworld.com accepts no liability for any errors in the articles or for any financial loss resulting from incorrect information.

Tatevik Avetisyan is an editor at Kriptoworld who covers emerging crypto trends, blockchain innovation, and altcoin developments. She is passionate about breaking down complex stories for a global audience and making digital finance more accessible.
📅 Published: October 31, 2025 • 🕓 Last updated: October 31, 2025
