


BNB trades inside a bullish symmetrical triangle on the 1-hour chart, with lower highs and higher lows squeezing price toward the apex.
This pattern shows that buyers and sellers push against each other while volatility compresses, and it often resolves in the direction of the prior uptrend.
Stay ahead in the crypto world – follow us on X for the latest updates, insights, and trends!🚀
Here, the move into the triangle came from a strong rally, so the structure points to a potential continuation higher once price breaks the upper trendline with stronger volume.
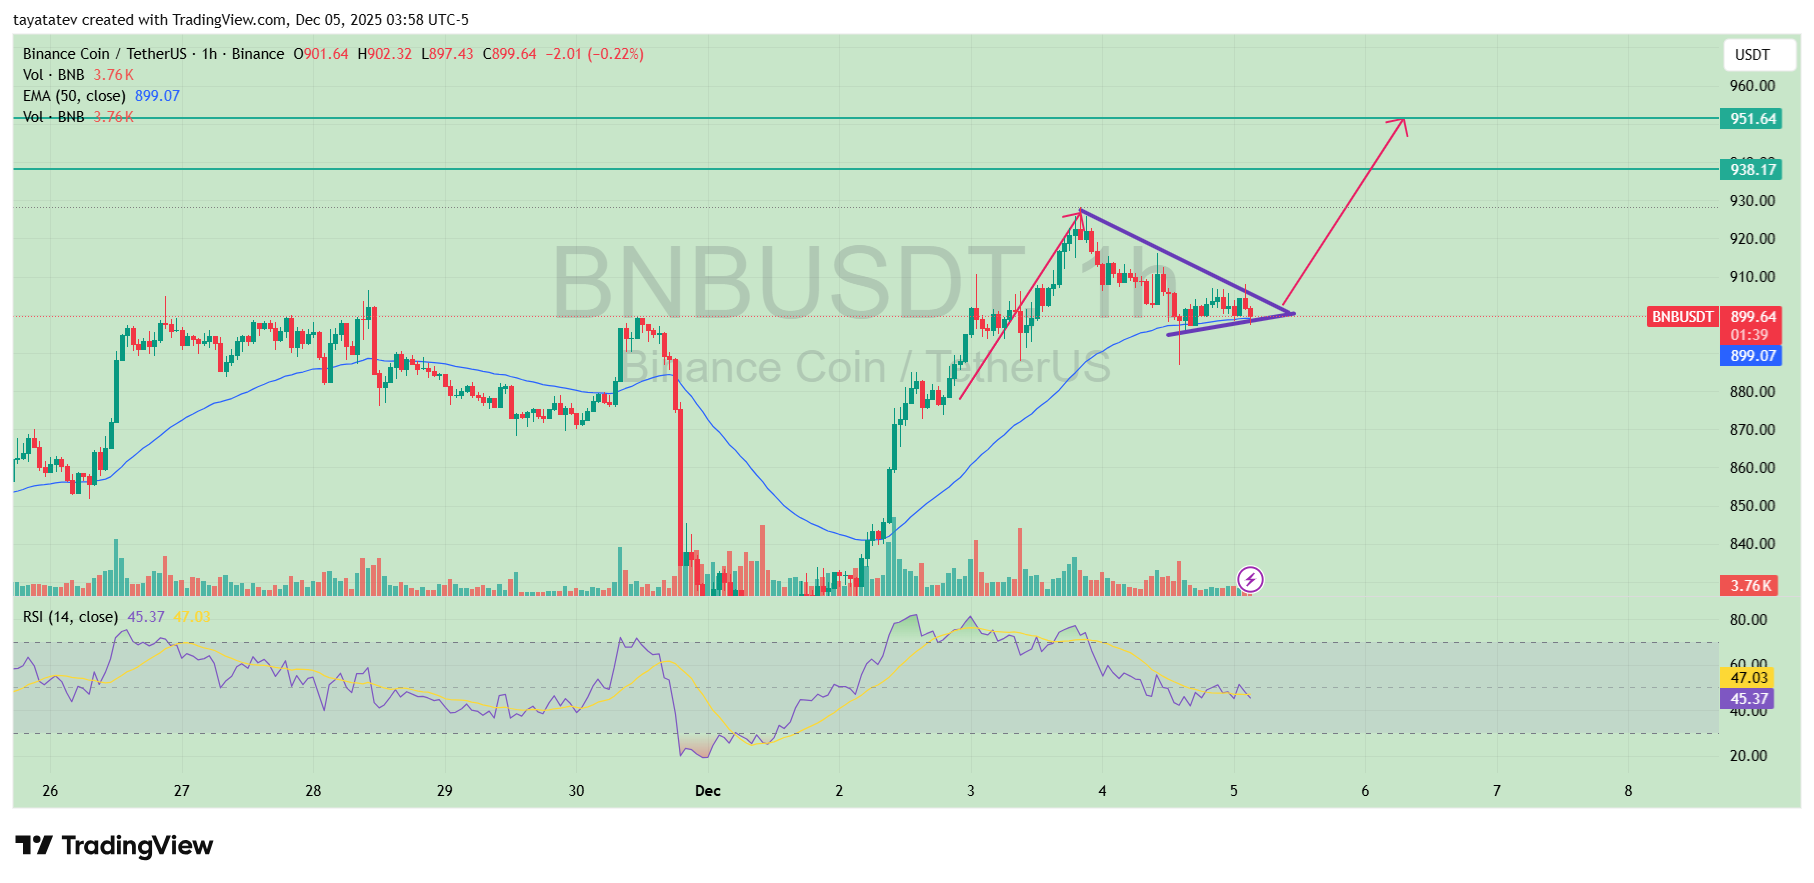
The height of the triangle measures roughly 52–55 dollars from base to top. If BNB breaks out near the current area around 899–900 dollars and respects the 50-EMA as support, the measured move points about 6 percent higher, toward roughly 951–954 dollars.
This zone matches the resistance line already marked on the chart, so a clean close above the triangle would confirm that bullish target.
BNB Weekly Stoch RSI Drops to Summer 2024 Lows
The weekly Stoch RSI for BNB falls back into the same deep oversold zone last reached in July–August 2024.
Both lines sit at the bottom of the oscillator and begin a new bullish crossover, which shows that downward momentum slows while early upward pressure forms.
This setting tells us that the recent pullback pushed momentum indicators to extreme levels even as price stabilizes on the weekly chart.
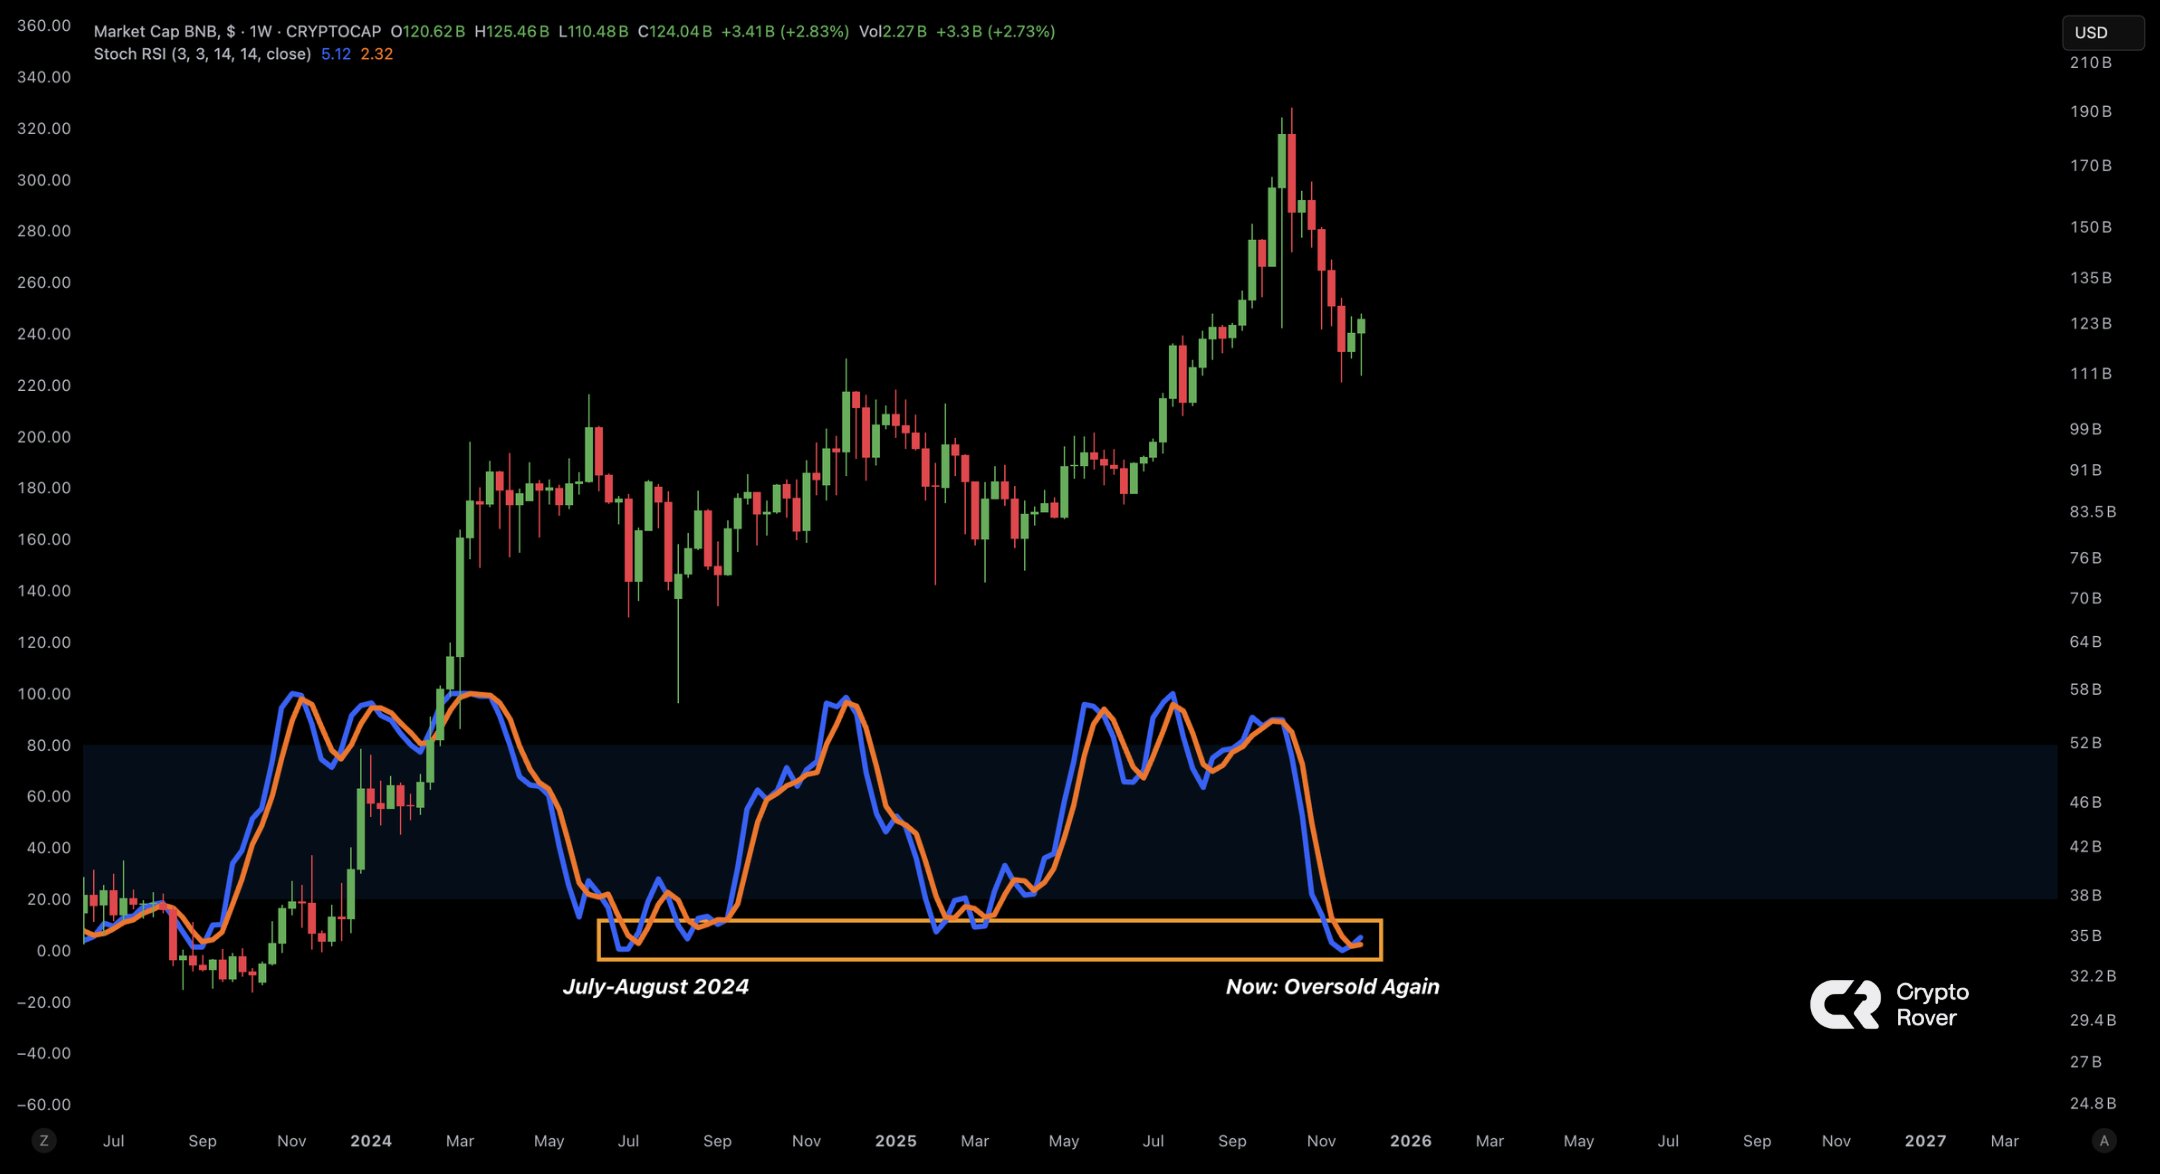
At the same time, the highlighted zone on the chart underscores how rare this Stoch RSI level is.
The last time BNB reached this range, the market later turned upward as momentum gradually recovered.
Although past behavior does not guarantee future movement, the indicator’s position offers a clear reference point that helps contextualize the current trend. Traders now monitor whether the crossover holds above the oversold band in the coming sessions.
Crypto Rover frames this setup by noting that BNB shows its lowest Stoch RSI reading since the summer of 2024 and calls the token “severely undervalued.”
The chart supports the claim about the indicator level, yet price still needs confirmation through stronger candles and increased volume before a decisive trend reversal forms.
Until that happens, the Stoch RSI signals only that momentum exhaustion appears, not that a full recovery has already begun.
Disclosure:This article does not contain investment advice or recommendations. Every investment and trading move involves risk, and readers should conduct their own research when making a decision.
Kriptoworld.com accepts no liability for any errors in the articles or for any financial loss resulting from incorrect information.

Tatevik Avetisyan is an editor at Kriptoworld who covers emerging crypto trends, blockchain innovation, and altcoin developments. She is passionate about breaking down complex stories for a global audience and making digital finance more accessible.
📅 Published: December 5, 2025 • 🕓 Last updated: December 5, 2025
