


Nov. 27, 2025 – Bonk’s BONK/USD 1-hour chart on Coinbase shows price consolidating inside a bullish flag pattern after a sharp move up from last week’s lows.
Candles now trade between two downward-sloping parallel lines, with BONK hovering near 0.00000979 dollars above the 50-period exponential moving average.
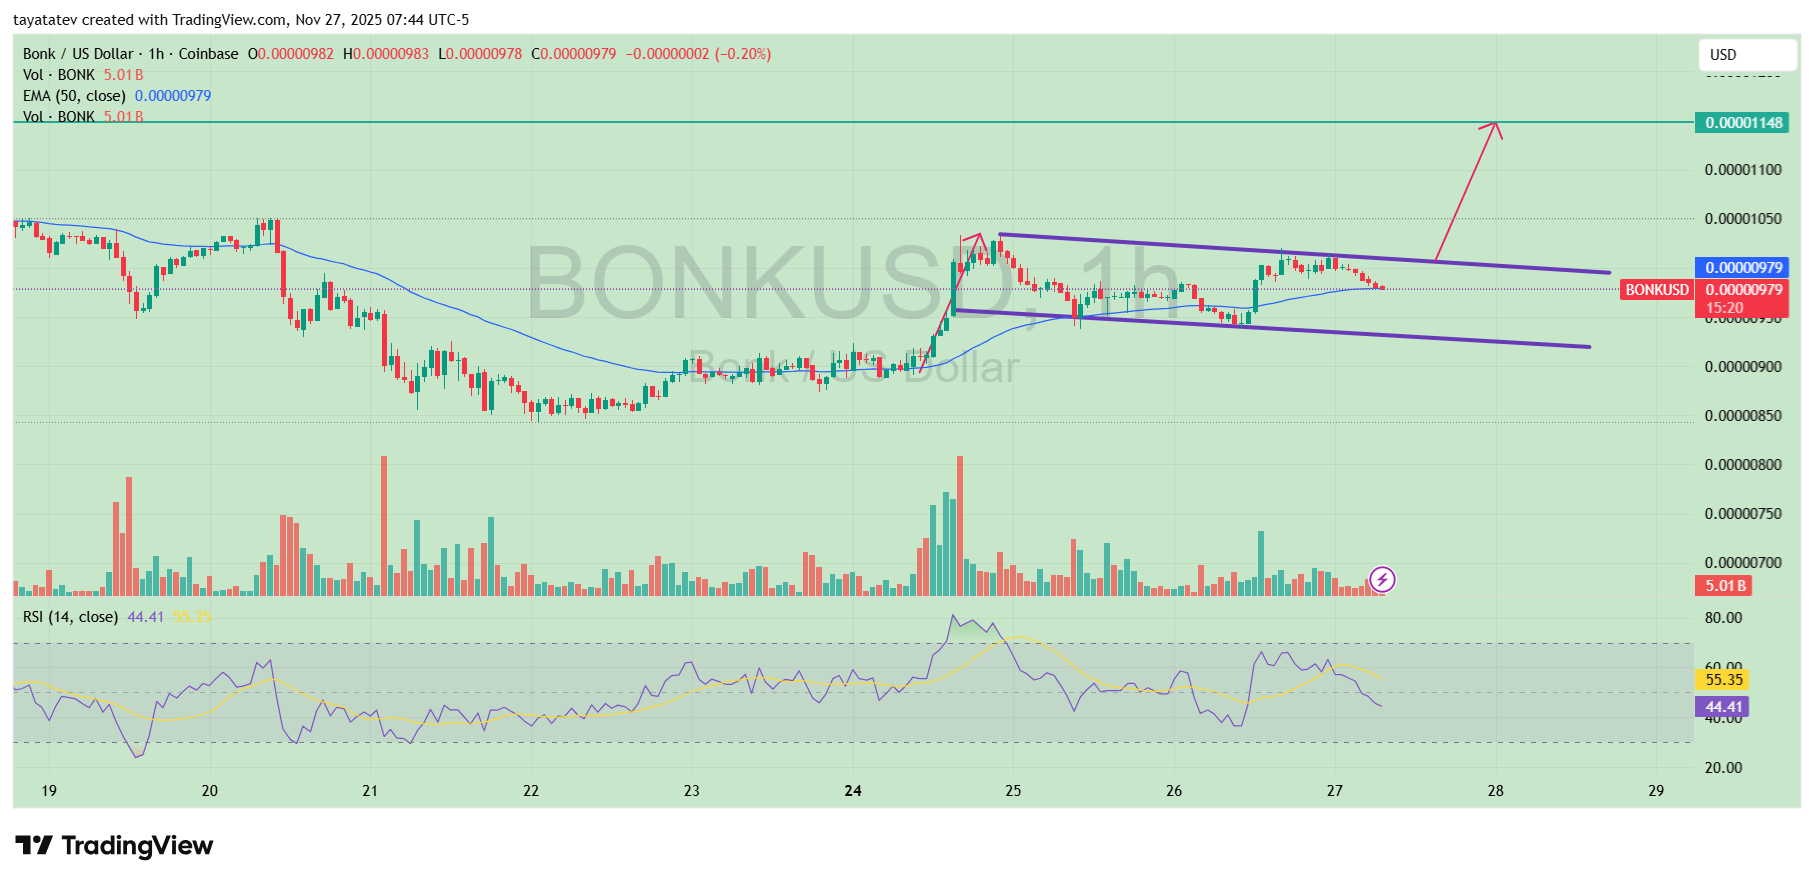
A bullish flag pattern appears when an asset pauses in a tight, downward-leaning channel after a strong upward rally, usually signaling continuation rather than reversal.
In this case, the flag’s upper boundary caps intraday rallies, while the lower boundary and the 50-EMA act as support as buyers defend higher levels than before the breakout move.
If BONK breaks and closes above the flag’s upper trendline with stronger volume, the pattern would confirm a continuation toward its measured objective.
The flagpole from the prior surge projects an upside move of roughly 17 percent from the current price, implying a potential target near 0.00001148 dollars if the breakout holds.
However, a sustained drop back below the lower flag boundary and the 50-EMA would weaken the pattern and suggest the consolidation is turning into a deeper pullback instead of a continuation.
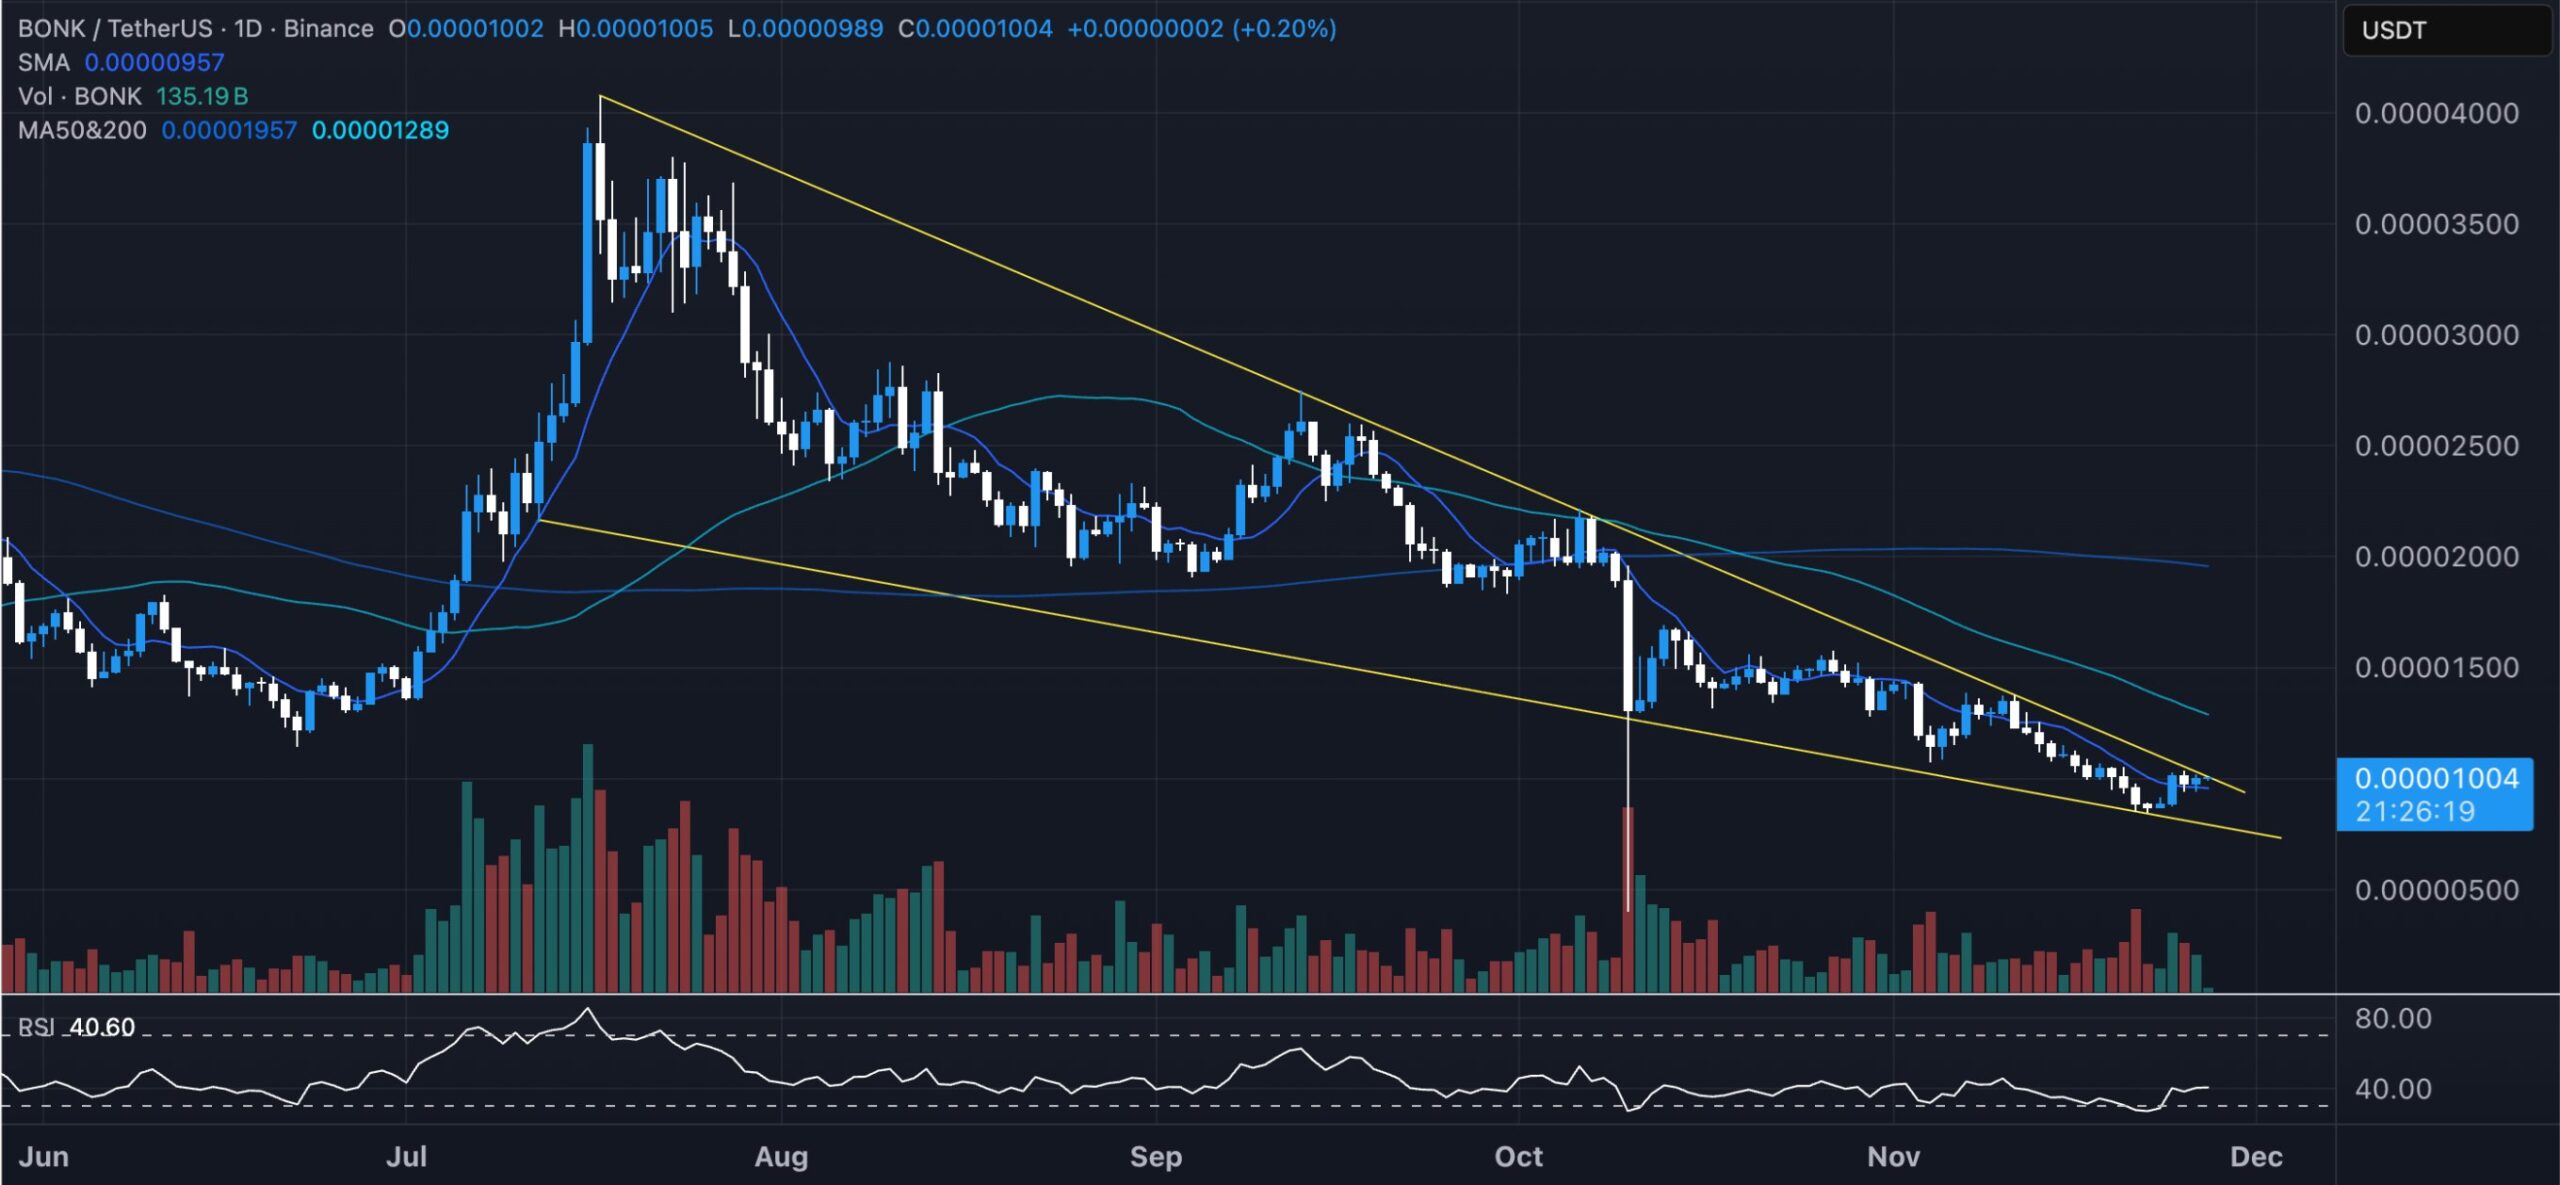
BONK Nears Breakout From Multi-Month Falling Wedge
BONK has spent recent months inside a descending wedge on Binance, with candles tightening between two falling trendlines as volatility cools.
The range now sits close to the wedge’s apex, where breakouts often occur when selling pressure fades.
Earlier on Nov. 27, a bullish flag formed on the 1-hour Coinbase chart after a sharp rally.
A bullish flag appears when price pauses in a short, downward-sloping channel following a strong move up, usually signaling continuation once buyers push through the flag’s upper boundary.
Unipcs, known as the “Bonk Guy,” wrote on X that BONK is “very close” to breaking this multi-month wedge.
He noted that traders have called the token “dead” several times in past cycles, only for it to recover and reach new all-time highs.
He added, “I do not think BONK is dead. If anything, I’m quite confident it’s going to make new ATHs.”
If BONK closes above the upper lines of both the intraday flag and the broader wedge with follow-through, the measured flagpole move points to roughly 17 percent upside toward the next technical objective on the chart.
Disclosure:This article does not contain investment advice or recommendations. Every investment and trading move involves risk, and readers should conduct their own research when making a decision.
Kriptoworld.com accepts no liability for any errors in the articles or for any financial loss resulting from incorrect information.

Tatevik Avetisyan is an editor at Kriptoworld who covers emerging crypto trends, blockchain innovation, and altcoin developments. She is passionate about breaking down complex stories for a global audience and making digital finance more accessible.
📅 Published: November 27, 2025 • 🕓 Last updated: November 27, 2025
