

 on Track for $104K")
BlackRock-linked wallets move 4,400 BTC as Bitcoin slips toward $105K
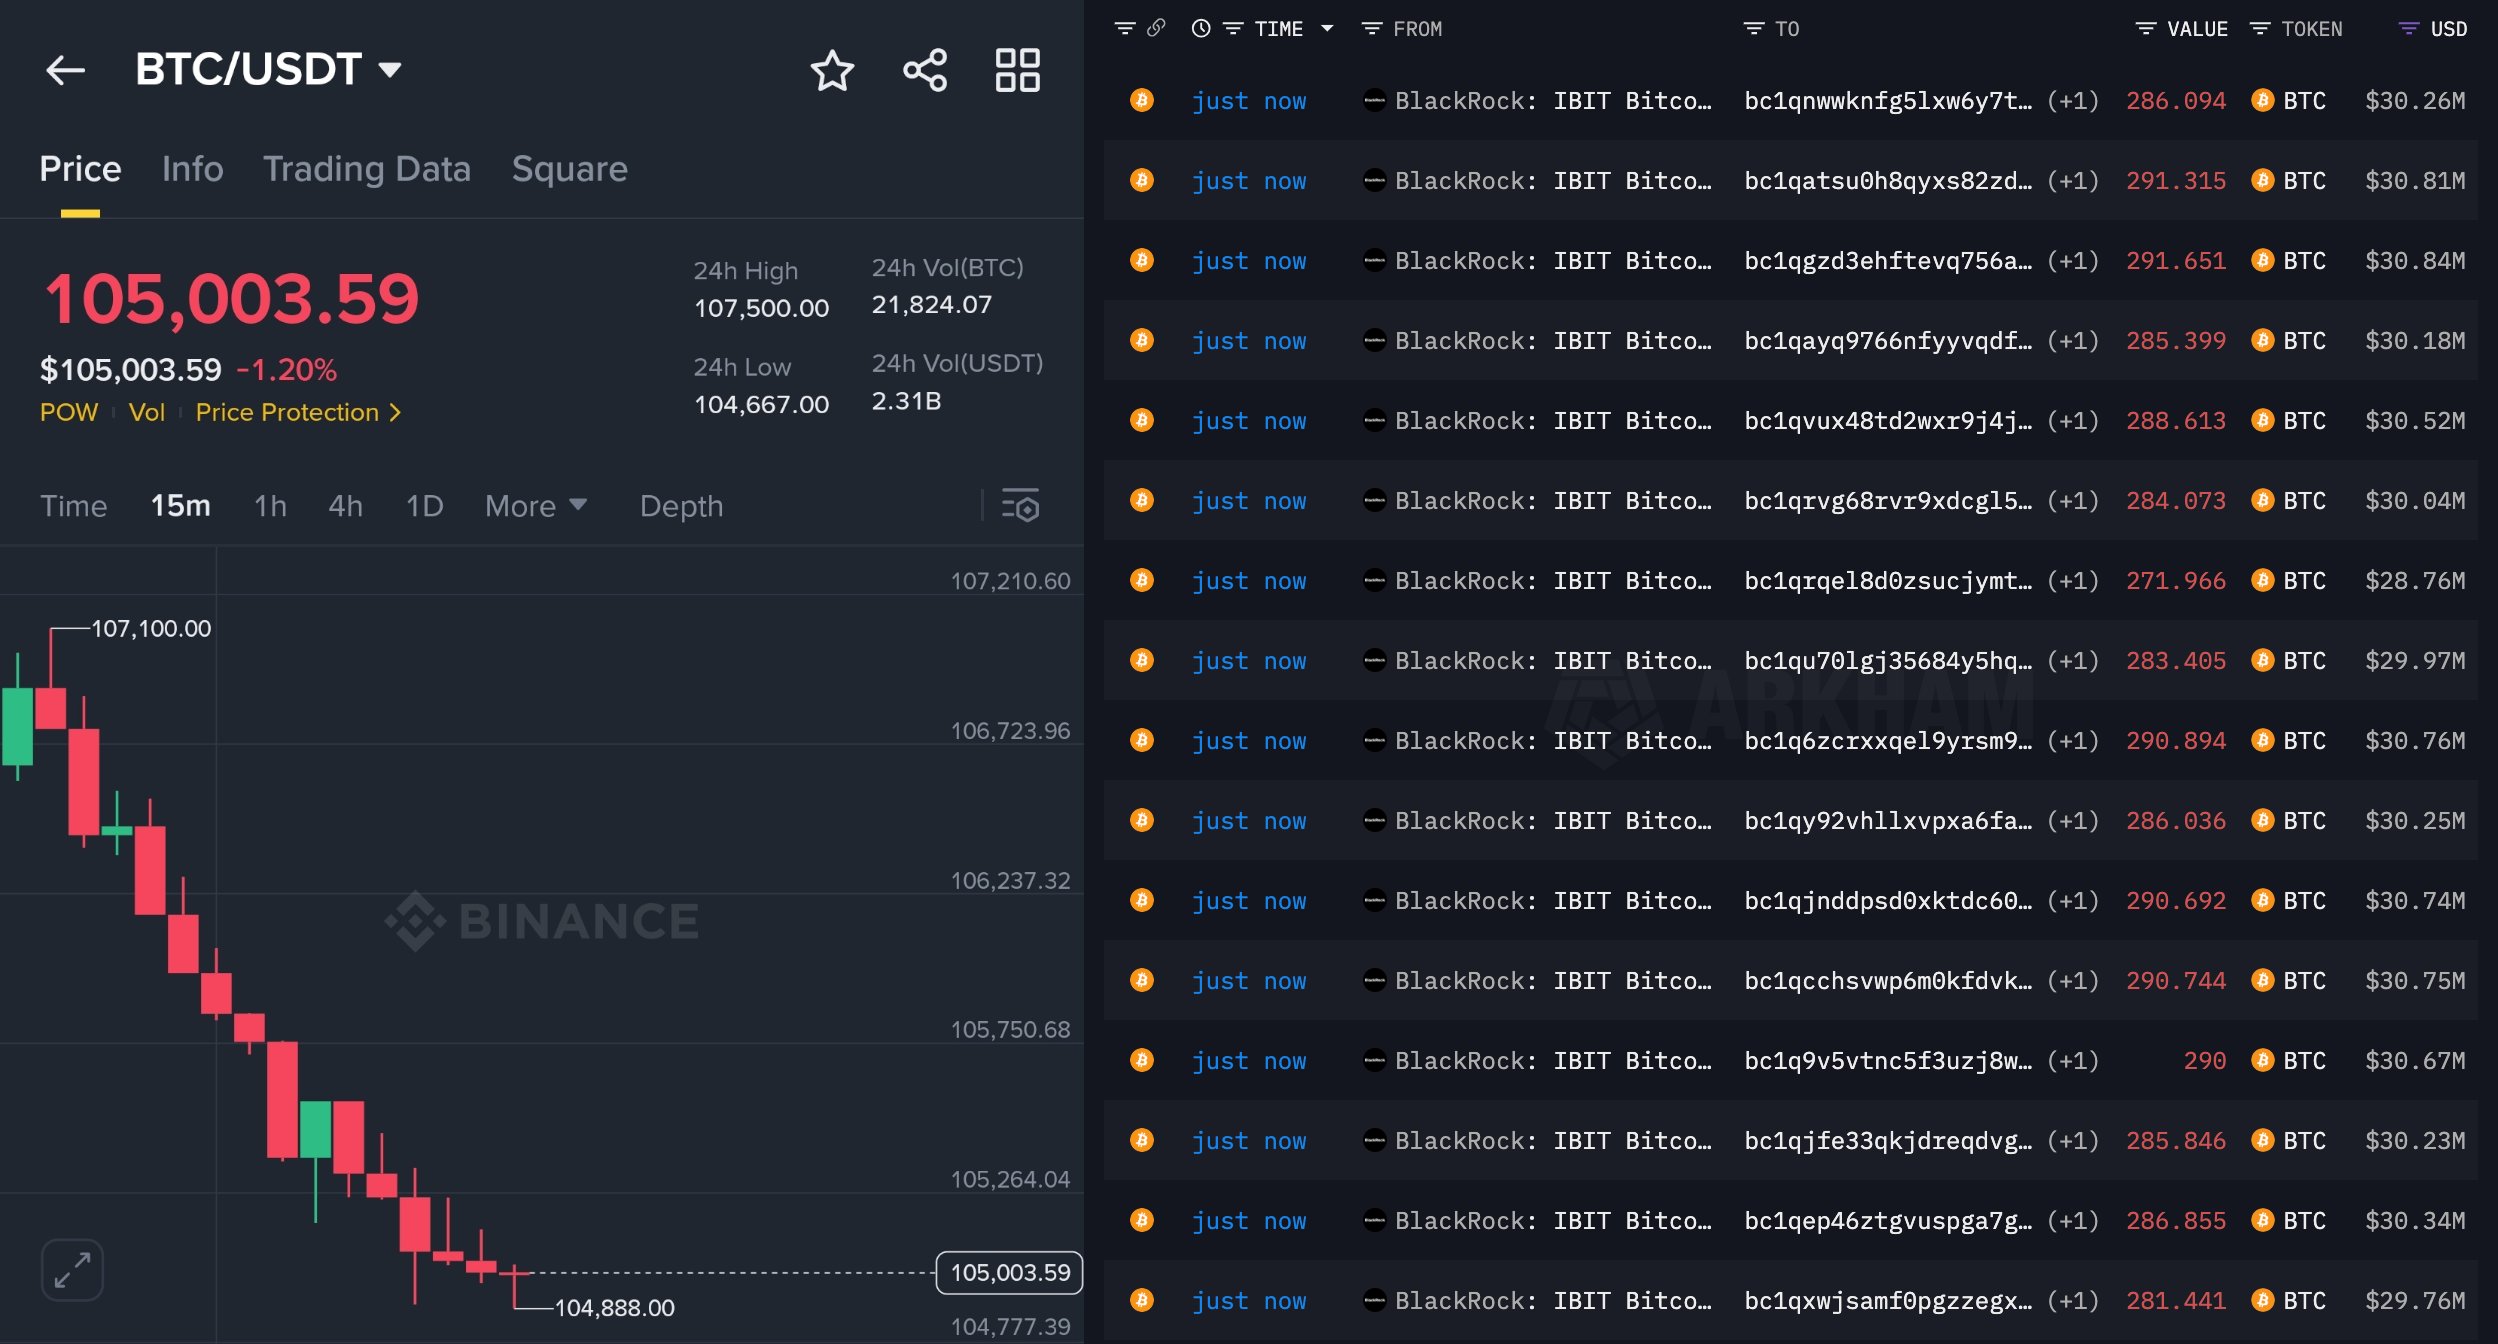
On-chain data from a whale-tracking dashboard shows multiple transfers from wallets labeled “BlackRock: IBIT Bitcoin ETF” to new Bitcoin addresses, each worth around 280–291 BTC, or roughly $30 million per move.
Stay ahead in the crypto world – follow us on X for the latest updates, insights, and trends!🚀
In total, the flagged transactions amount to about 4,400 BTC, worth close to $500 million at current prices.
At the same time, Binance’s BTC/USDT pair traded near $105,000 after dropping from an intraday high above $107,000.
The flows surfaced shortly before a scheduled speech by former U.S. President Donald Trump, drawing quick reactions across X.
Commentator 0xNobler claimed that BlackRock had “started dumping Bitcoin” and continued to sell more every hour as fresh transfers hit the tracker.
The combination of heavy ETF-linked outflows and a sharp intraday price slide fueled speculation about whether the selling was tied to expectations around Trump’s remarks.
So far, BlackRock has not publicly commented on the transactions, and the motive behind the movements remains unclear.
The transfers could reflect profit-taking, internal rebalancing, or routine ETF operations rather than a directional bet on Trump’s speech.
However, the timing and size of the moves have made the IBIT flows a focal point for traders watching Bitcoin’s price action around the event.
Bitcoin price eyes $104K CME gap after rejection at $107K
Bitcoin reversed from the $107,000–$108,000 resistance band and slipped back toward support near $104,000, TedPillows’ daily chart shows.
The rejection confirms that sellers still defend the mid-range supply zone that capped several rallies in recent weeks.
At the same time, price continues to trade below a higher resistance cluster around $111,000, keeping the short-term structure pressured.
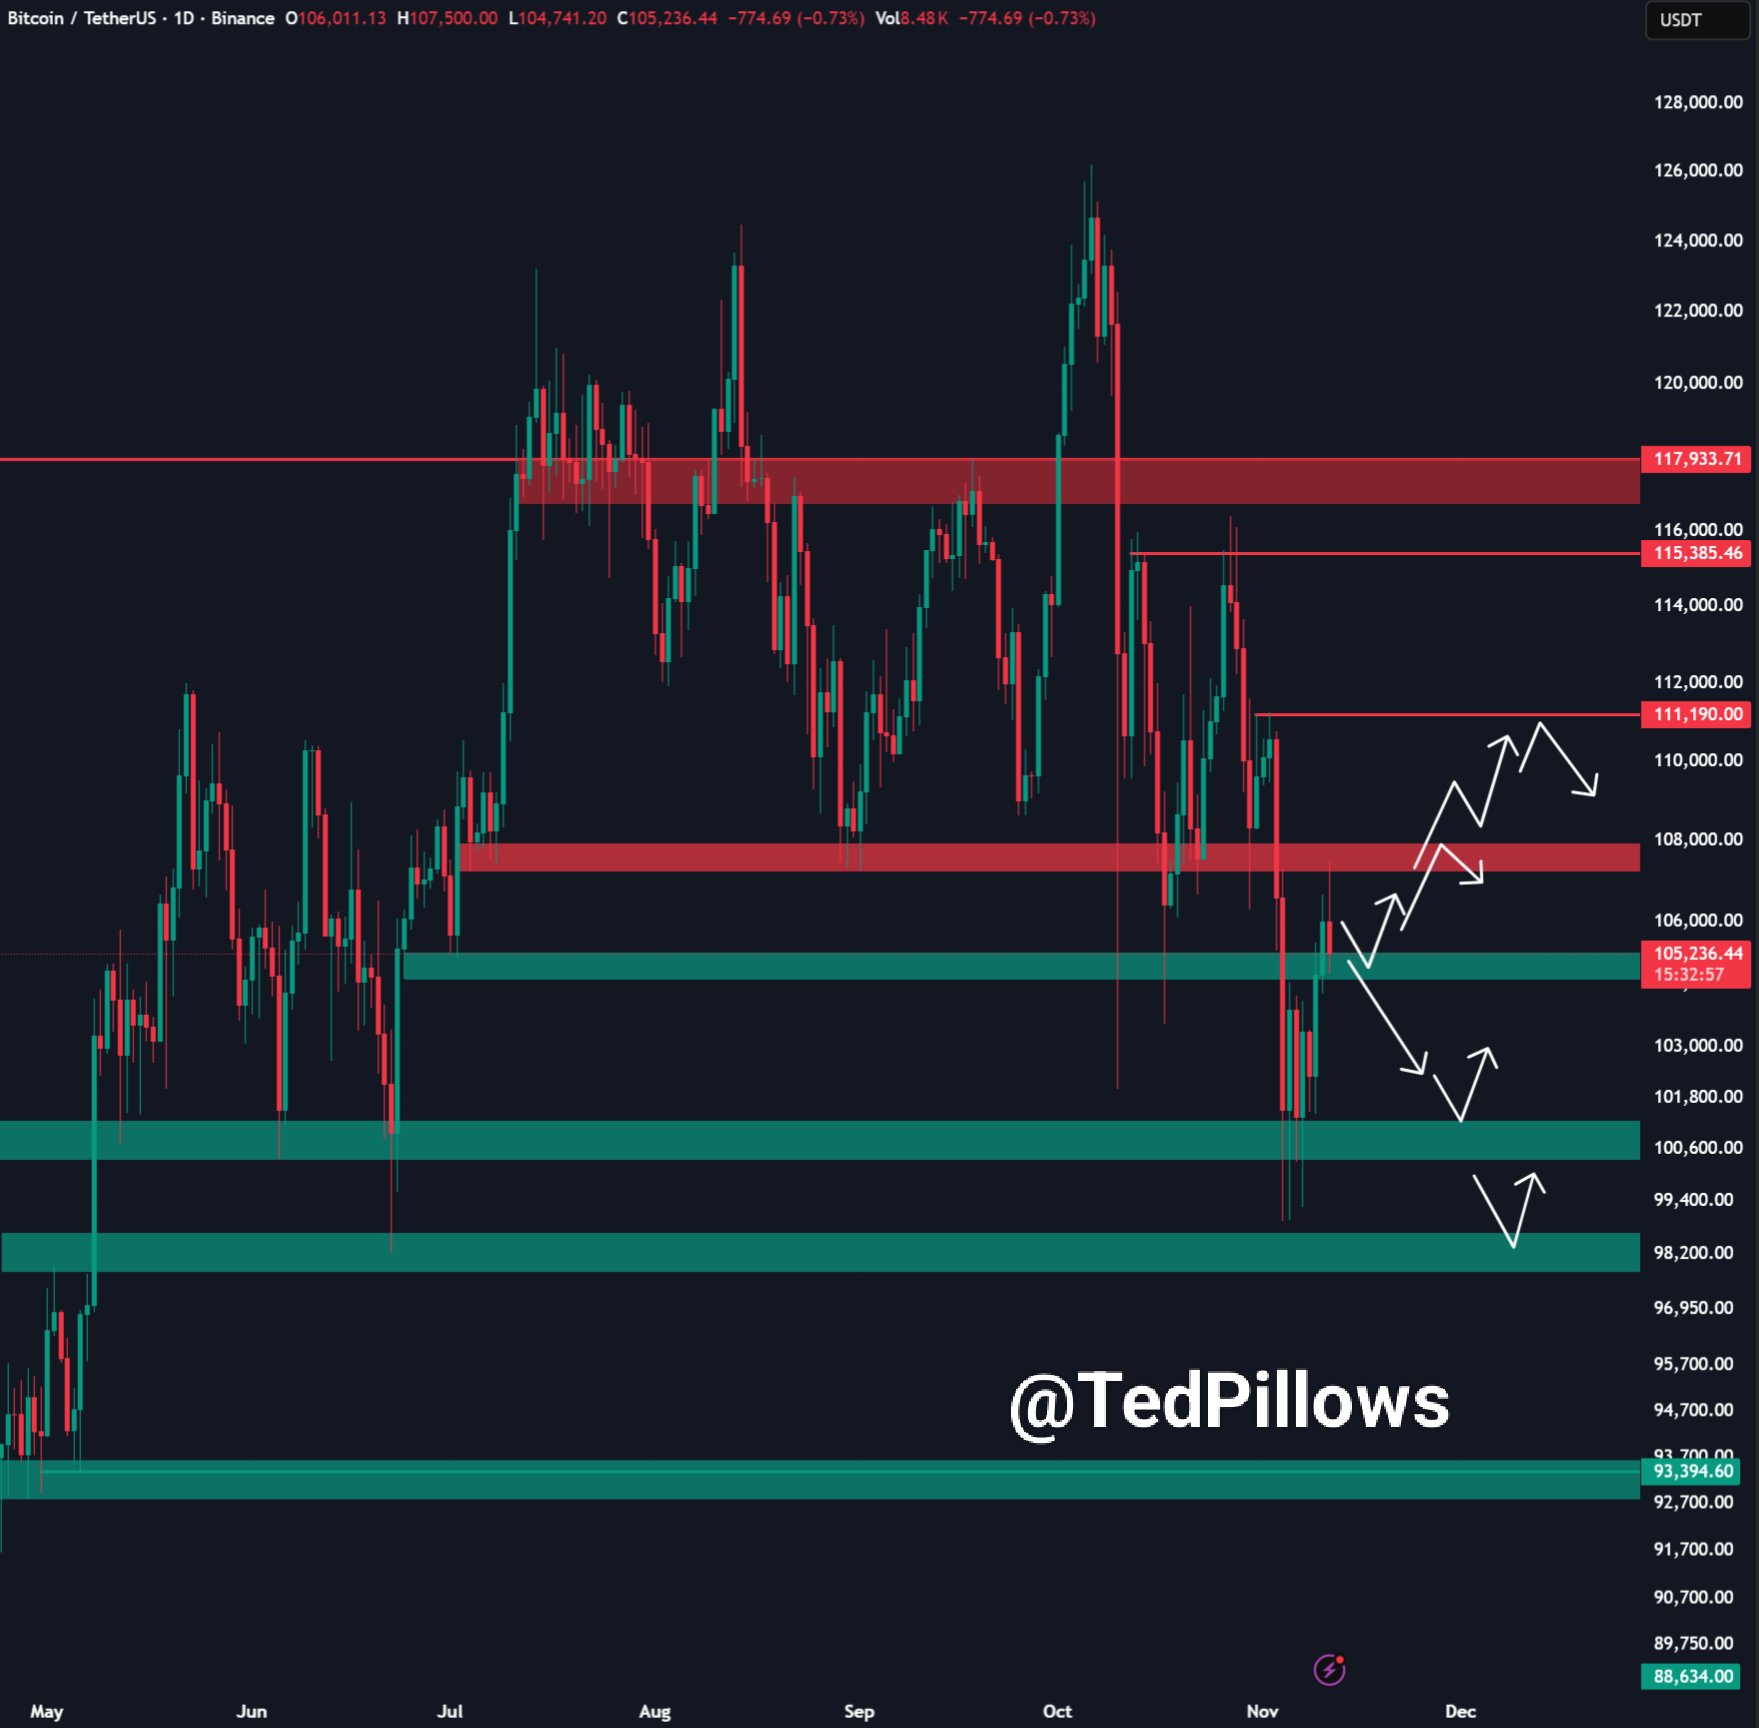
Now, attention shifts to the green support block around $104,000, which aligns with an open CME futures gap.
Traders often track these gaps because Bitcoin has historically revisited many of them, turning the area into a key level on both spot and derivatives charts.
If the market drives price into that zone, it would test the first major demand region beneath the recent high.
Ted notes that Bitcoin “usually bottoms on Tuesday,” pointing to a recurring weekly pattern where local lows often appear early in the week.
Therefore, the scenario on the chart outlines a possible dip into the $104,000 gap followed by a bounce back toward the $107,000–$108,000 resistance.
However, if buyers fail to defend the gap, the path opens to lower green support bands below $101,000 highlighted on the chart.
Bitcoin 4-hour chart prints rising wedge with 6% downside target
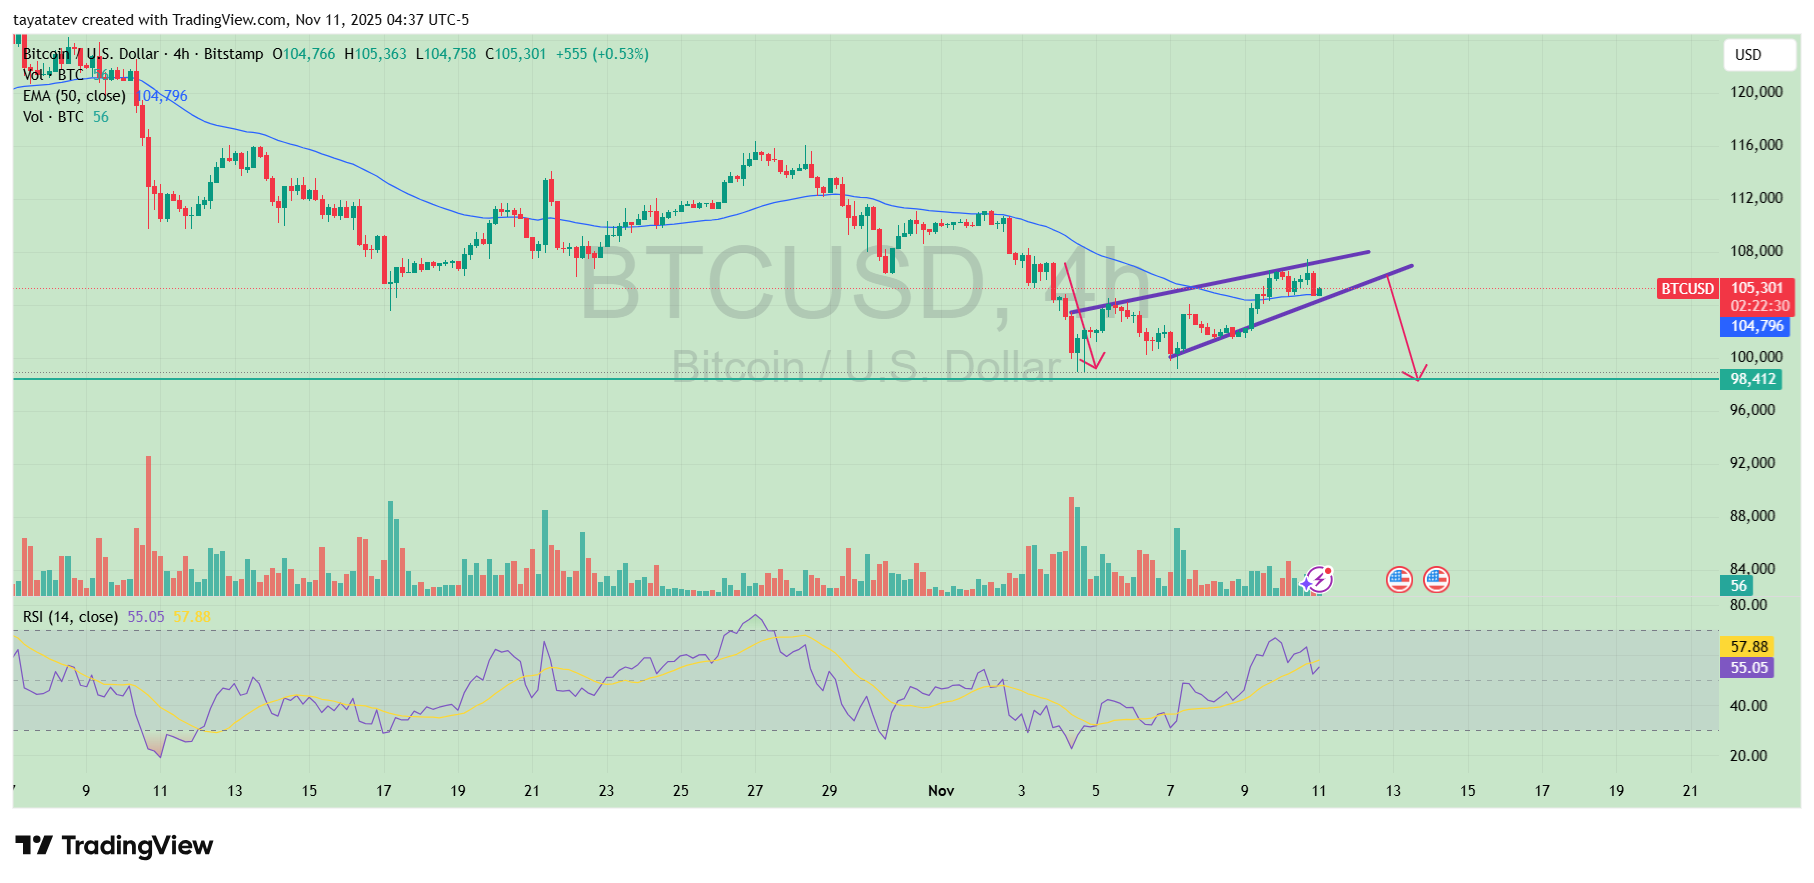
Bitcoin’s 4-hour BTCUSD chart on Bitstamp shows price trading near 105,300 dollars while climbing inside a short-term rising wedge.
The pattern formed after a sharp early-November sell-off, with the rebound stalling just under the 50-period exponential moving average around 104,800 dollars.
The chart also highlights horizontal support near 98,400 dollars as the next major demand zone.
A rising wedge appears when both highs and lows move higher, yet the two trendlines converge.
Price grinds upward, but each new high shows less strength than the last one. In a downtrend, technicians usually treat this structure as a bearish continuation pattern once candles close below the lower wedge line.
On this chart, the upper boundary capped the latest push, while the lower boundary tracks the sequence of higher lows from the recent bottom.
Volume eased during the climb, which contrasts with the heavy selling that started the move and supports the idea of a corrective bounce rather than a fresh impulsive leg.
At the same time, the relative strength index sits just below the overbought area, near 58, after recovering from sub-40 levels earlier in the month.
This setup signals fading momentum as price approaches resistance and the 50 EMA.
If Bitcoin breaks and closes below the wedge’s lower trendline, the pattern’s measured move points to a decline of around 6 percent.
That would mean a potential slide from roughly 105,000 dollars toward about 98,400 dollars, in line with the drawn support band on the chart.
Traders now watch that boundary and the reaction around the wedge support to see whether the short-term structure confirms or invalidates this bearish continuation signal.
Disclosure:This article does not contain investment advice or recommendations. Every investment and trading move involves risk, and readers should conduct their own research when making a decision.
Kriptoworld.com accepts no liability for any errors in the articles or for any financial loss resulting from incorrect information.

Tatevik Avetisyan is an editor at Kriptoworld who covers emerging crypto trends, blockchain innovation, and altcoin developments. She is passionate about breaking down complex stories for a global audience and making digital finance more accessible.
📅 Published: November 11, 2025 • 🕓 Last updated: November 11, 2025
