


Dogecoin is flashing two major reversal signals at the same time, with both the three-day and weekly charts sitting inside key support zones.
The setup gains extra weight as Grayscale’s new GDOG ETF enters the U.S. market, adding fresh attention to the meme-coin’s next move.
Dogecoin Tests Key Support as Trader Signals Possible Reversal
Dogecoin is holding above a major support area while a key analyst says the chart is close to triggering a bullish reversal. The setup comes as Grayscale’s new Dogecoin ETF, GDOG, begins trading in the United States.
Crypto trader Rand (CryptoRand) shared a three-day DOGE chart showing price pressing against a horizontal support zone after weeks of lower highs.
The latest candles show Dogecoin stabilizing near the mid-$0.14 region, with a short descending trendline capping attempts to move higher.
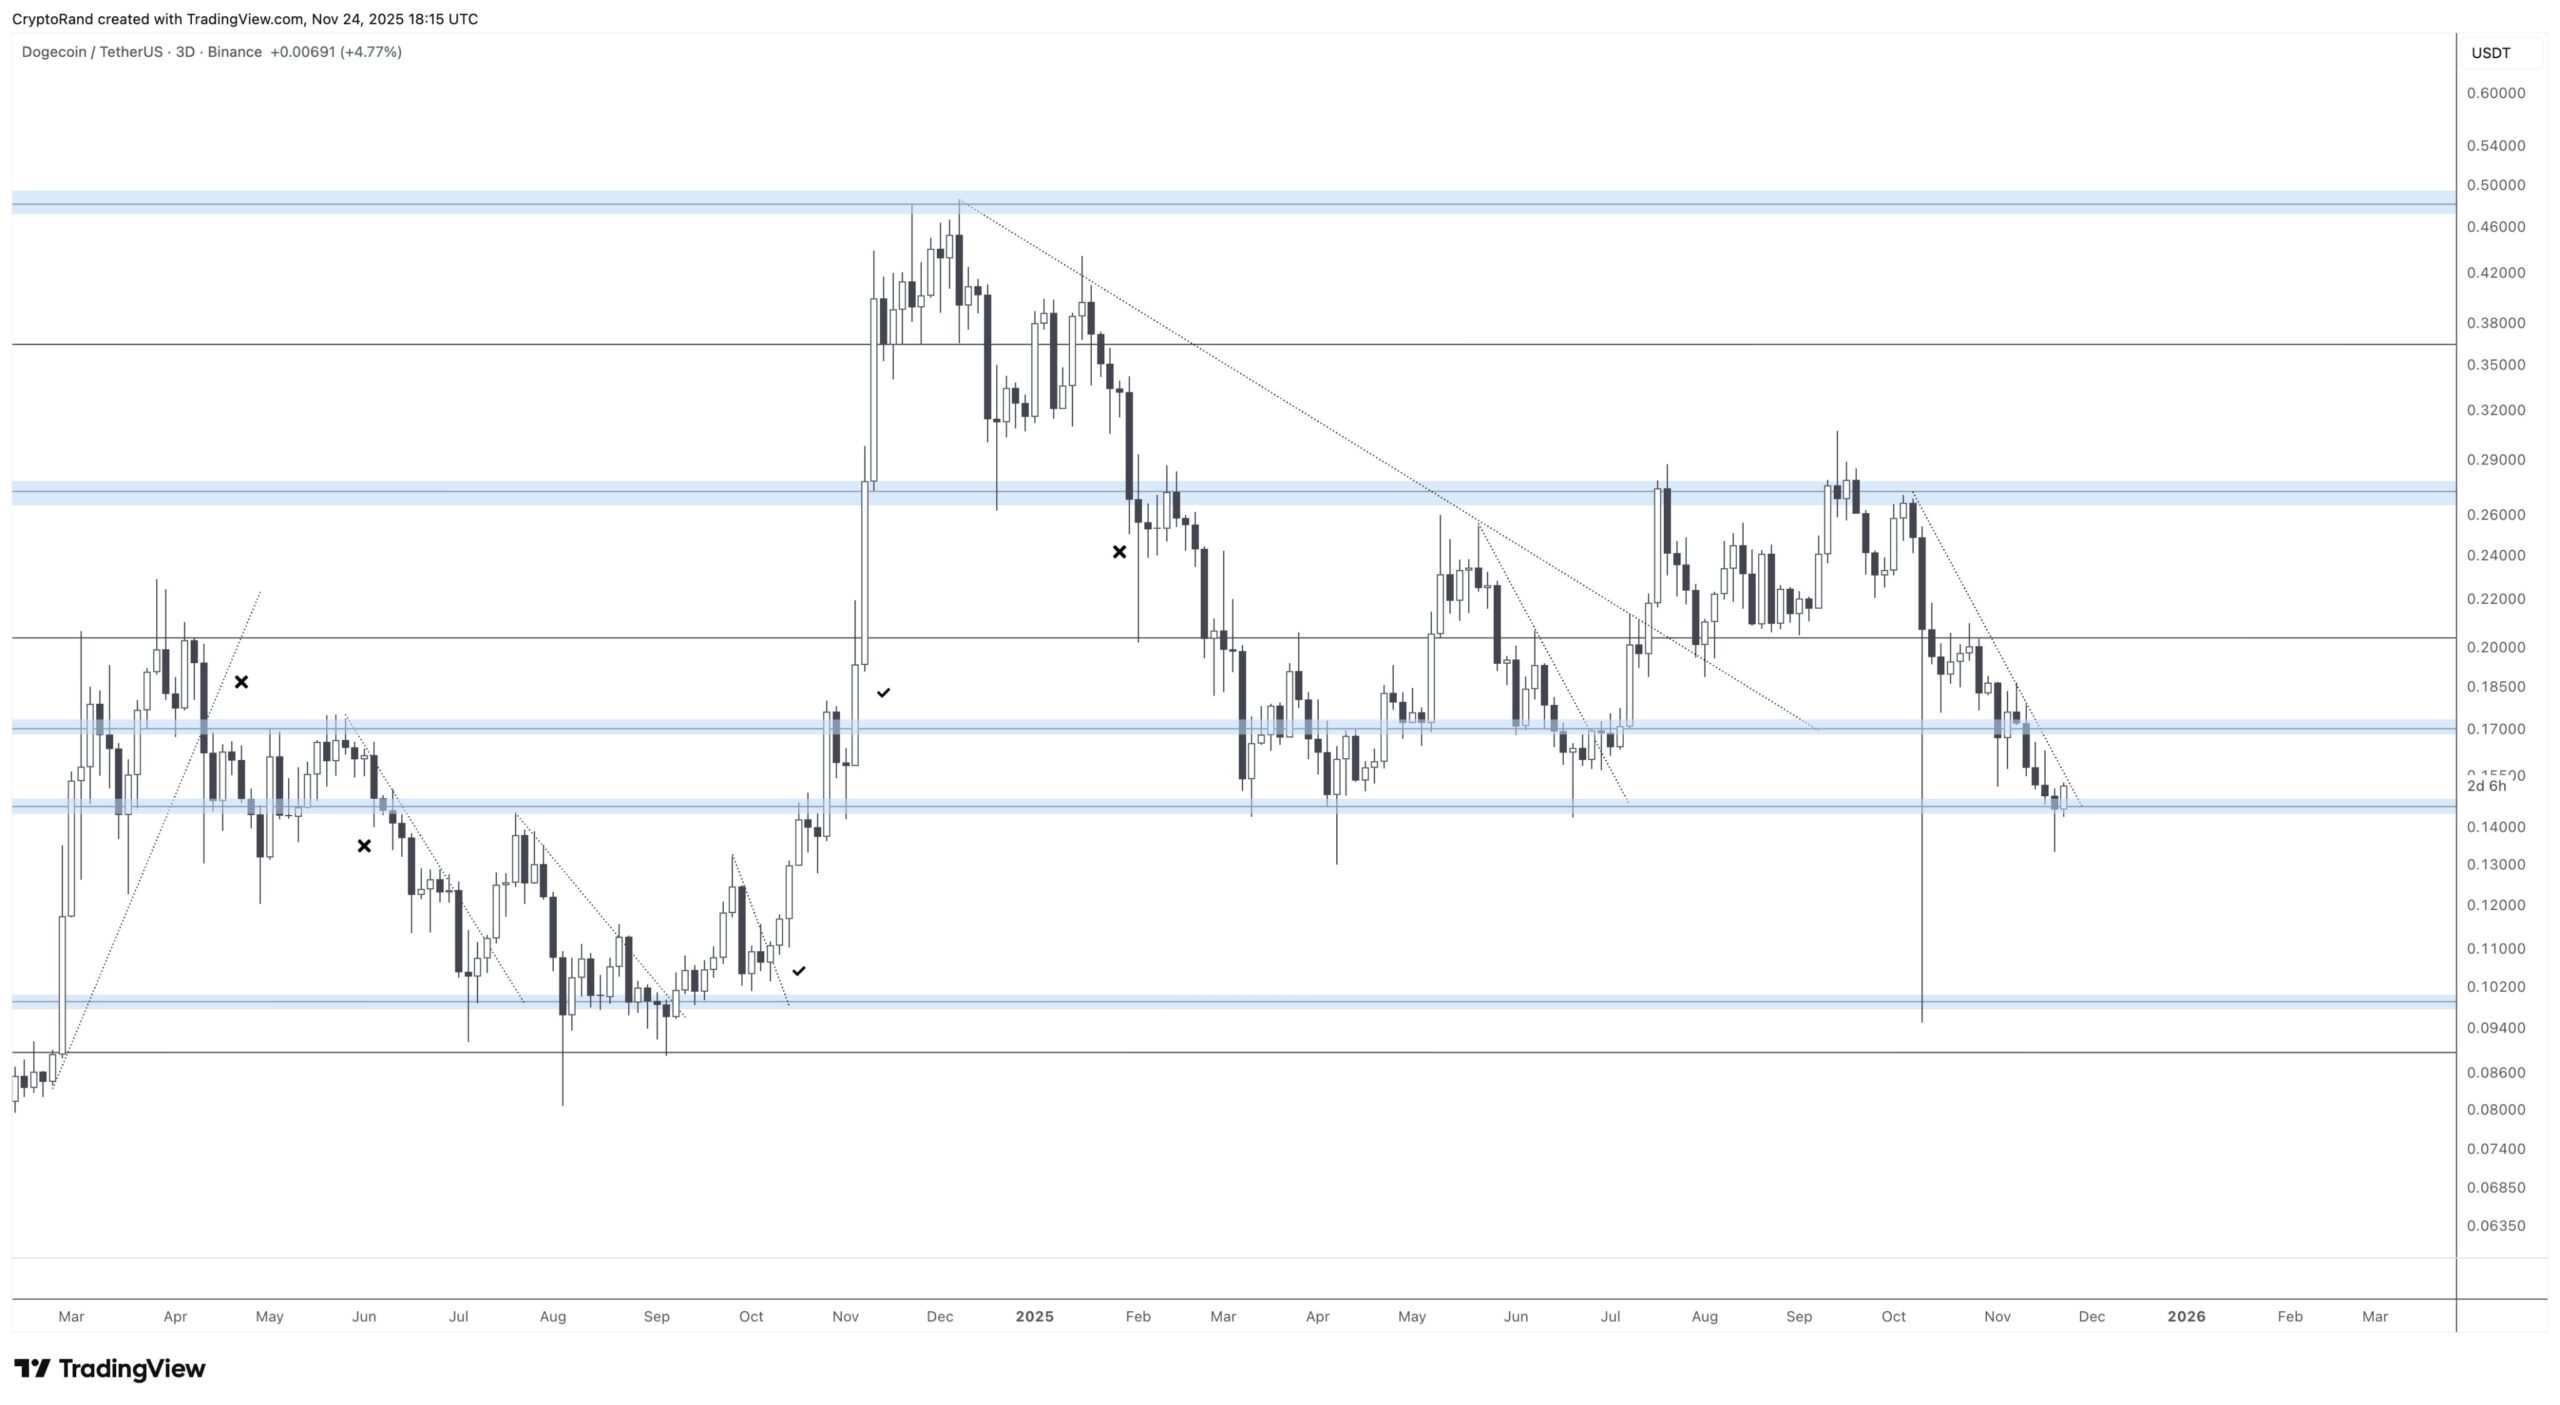
At the same time, the chart highlights several previous reactions at this level, suggesting that buyers have defended the area multiple times.
The structure now places DOGE at a decision point: a break above the trendline could reopen the path toward resistance levels visible on the chart, including the $0.18 and $0.20 zones. However, a clean drop below the support block would expose levels reached earlier in the year.
Meanwhile, interest around Dogecoin increased as Grayscale’s Dogecoin ETF, GDOG, went live in the U.S. market. Rand linked the timing to the chart setup, describing the moment as one worth watching.
The combination of a critical technical support zone and new ETF attention has put Dogecoin back in focus.
Price action around the current level will determine whether the market follows Rand’s expected reversal or extends its recent downtrend.
Dogecoin Sits Inside a Reversal Zone as Fibonacci Levels Tighten
Dogecoin is trading inside a technical zone where previous cycles often produced reversal moves, according to the latest weekly chart.
Price is holding near the mid-$0.15 area while the structure shows exhaustion after months of lower highs.
At the same time, candles continue to close above a long-term horizontal band that has acted as support since early 2023. This zone now forms the base of the potential bounce setup visible on the chart.
The weekly view also shows Dogecoin pressing against a descending trendline that has guided the downtrend since the July peak.
As price stabilizes just beneath this line, the structure suggests consolidation rather than continuation, especially as the rejection wicks are shortening.
The volume spike at the recent low further highlights interest at this level, signaling that buyers continue to defend the range.
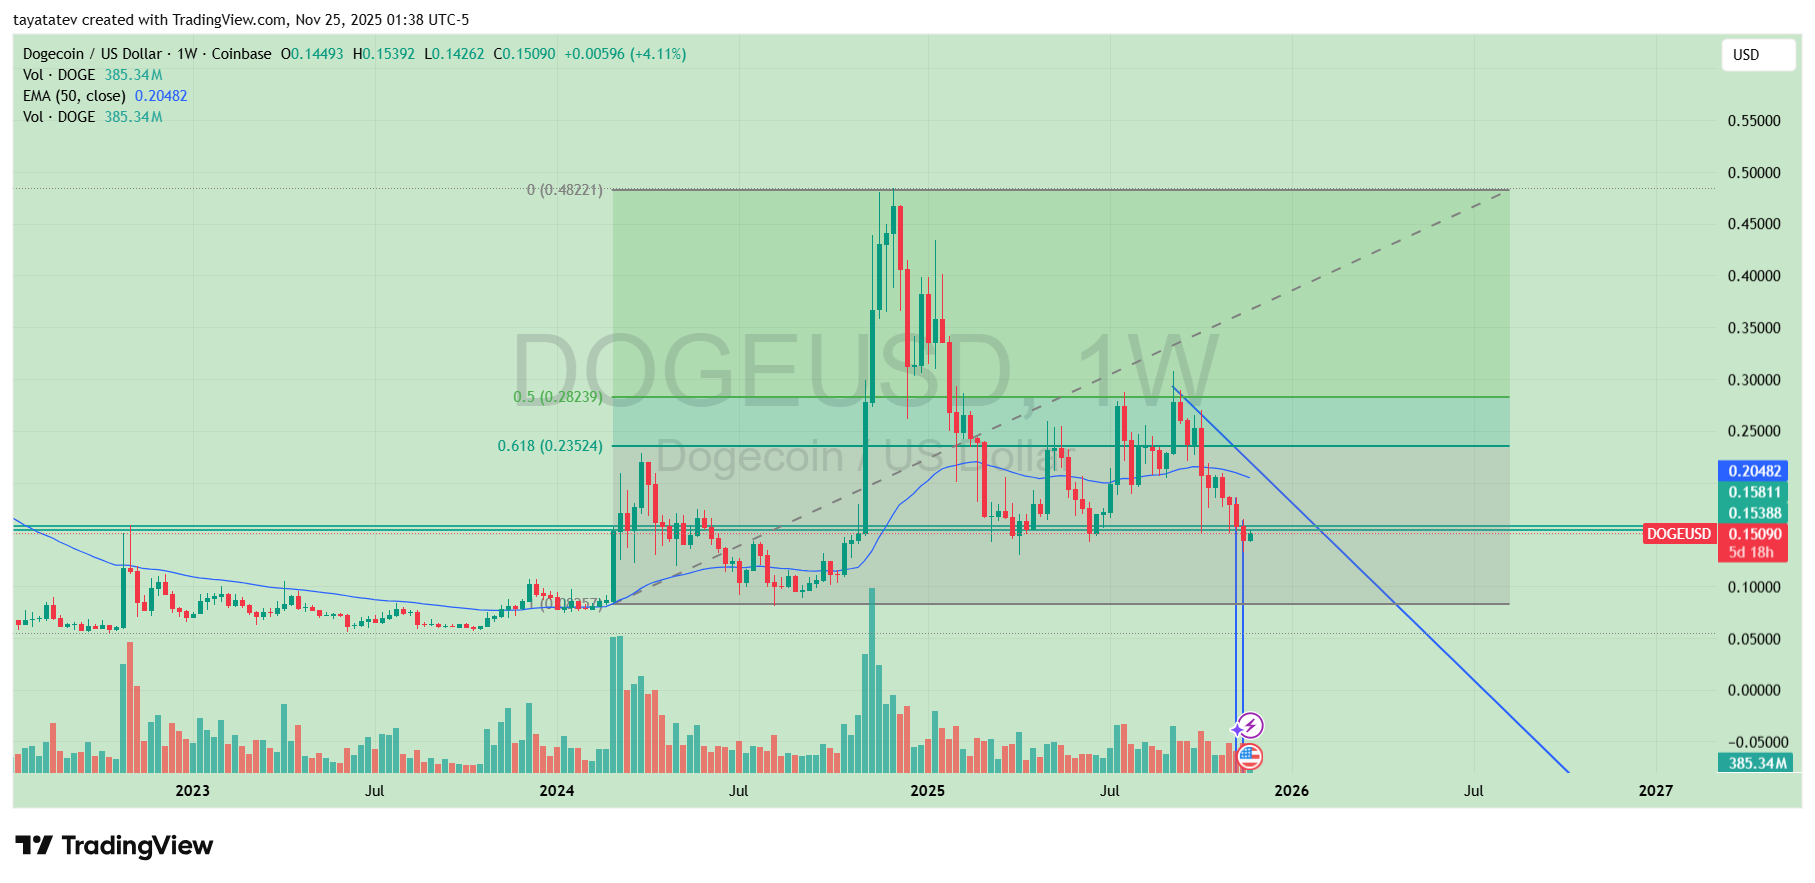
Meanwhile, the Fibonacci retracement levels place Dogecoin directly inside the golden zone. The 0.5 level sits around $0.282, while the 0.618 level aligns near $0.235.
Although price remains below both levels, the chart shows that DOGE completed a full retrace into the lower bound of the broader Fibonacci structure, which often precedes a recovery toward the midpoint.
This region has marked major turning points during past Dogecoin cycles, and the confluence adds weight to the reversal case.
Additionally, the long-term shaded Fibonacci projection zone extends toward the previous $0.48 peak. The chart illustrates how Dogecoin historically accelerates once it breaks through the 0.382 area, though it remains well below that threshold for now.
However, the combination of a tested support band, a flattening EMA50, and long-term Fibonacci alignment creates a clear inflection point on the weekly timeframe.
Dogecoin now trades at a moment where technical conditions favor a rebound more than an extended decline.
Whether price breaks through the trendline or revisits lower support will determine the next leg, but the chart places DOGE squarely in the zone where reversals typically start.
Disclosure:This article does not contain investment advice or recommendations. Every investment and trading move involves risk, and readers should conduct their own research when making a decision.
Kriptoworld.com accepts no liability for any errors in the articles or for any financial loss resulting from incorrect information.

Tatevik Avetisyan is an editor at Kriptoworld who covers emerging crypto trends, blockchain innovation, and altcoin developments. She is passionate about breaking down complex stories for a global audience and making digital finance more accessible.
📅 Published: November 25, 2025 • 🕓 Last updated: November 25, 2025
