


Ethereum slid sharply on Feb. 6, extending a multiweek decline and breaking below its last visible support band on the daily chart.
ETH fell from roughly $2,850 to about $1,943 on Bitstamp, a drop of around $907, or about 32%, in a single session.
Stay ahead in the crypto world – follow us on X for the latest updates, insights, and trends!🚀
The move pushed price well under the rising trendline that had guided late-January consolidation, while sellers pressed through prior horizontal supports near the high-$2,800s and low-$3,000s.
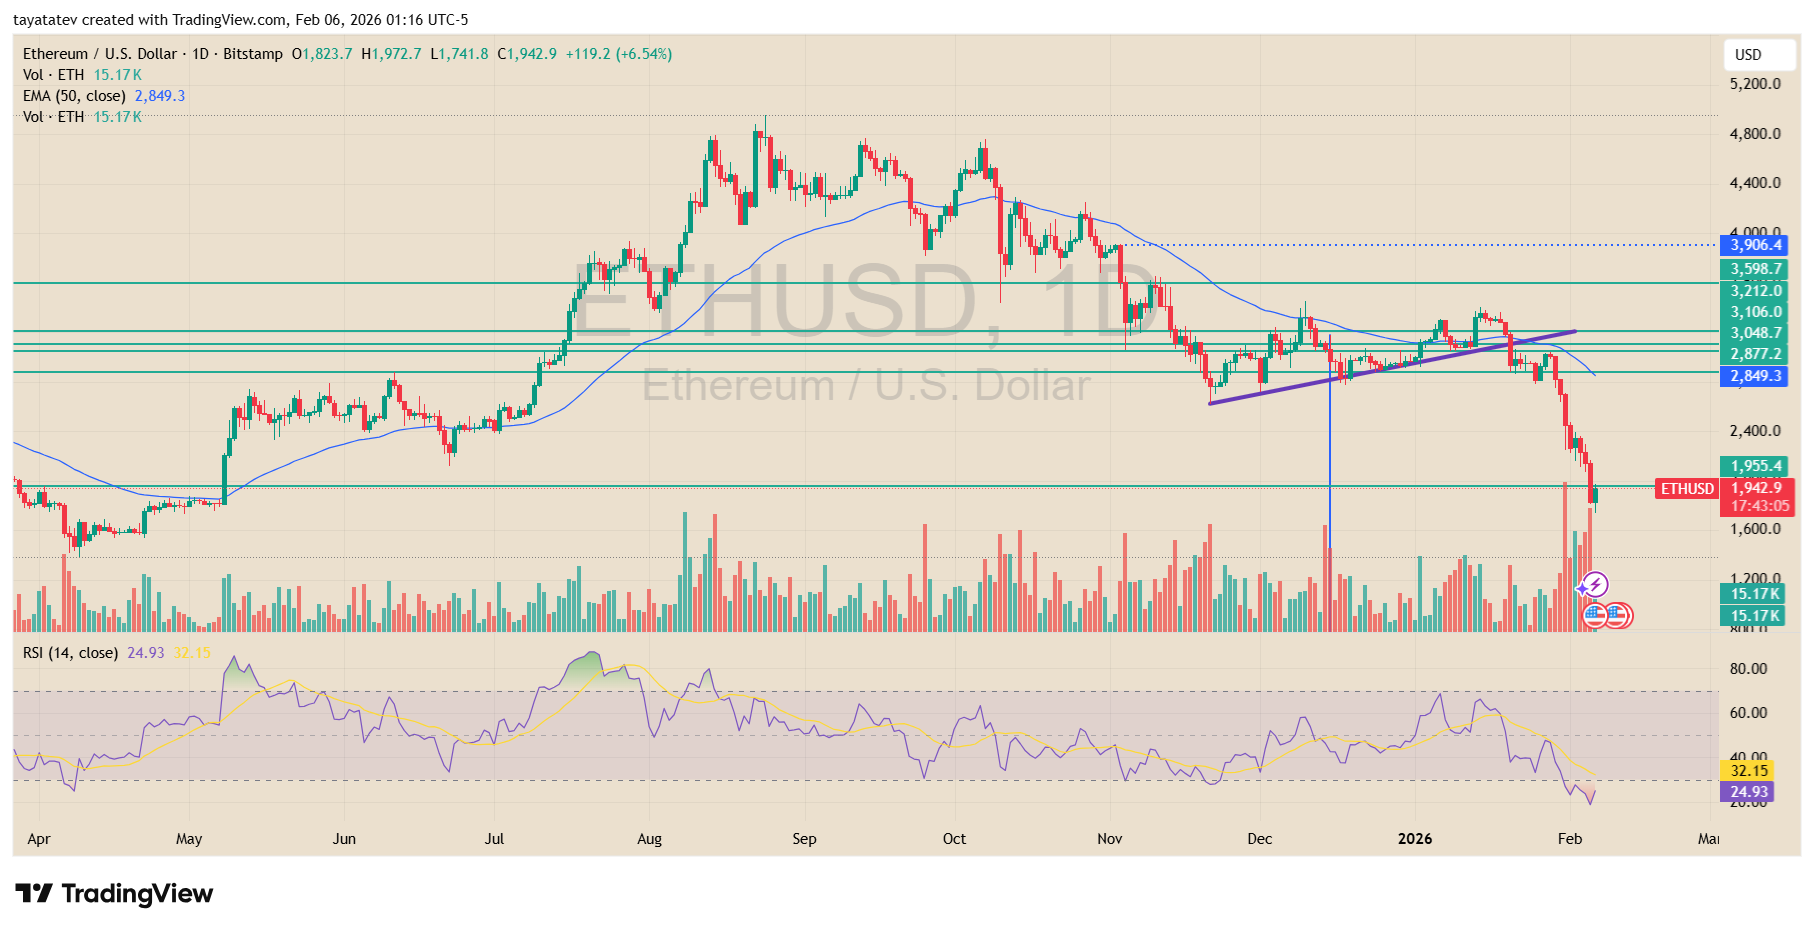
As a result, ETH also lost the 50-day exponential moving average, which had already turned into overhead resistance.
Price failed to hold the former base built through December and January, then accelerated lower after breaking the lower boundary of the short-term structure.
The breakdown confirmed a trend continuation to the downside, rather than another range phase.
At the same time, volume expanded during the selloff, reflecting heavy distribution into the break. Momentum followed price lower.
The 14-day RSI fell into the low-20s, marking a deeply oversold reading on the daily timeframe.
Together, the loss of trend support, the clean break of prior demand zones, and rising sell volume show that sellers remain in control as price resets below the former support cluster.
Liquidation bands cluster above ETH as price chops lower
A 24 hour ETH USDT liquidation heatmap for Gate showed thick leverage bands stacked above price during the Feb. 5 to Feb. 6 session, with the brightest clusters concentrated from roughly $2,000 to $2,100 and again closer to the low $2,200s.
Those zones sat above most of the trading range, showing where large pockets of liquidation risk had built up if ETH pushed higher.
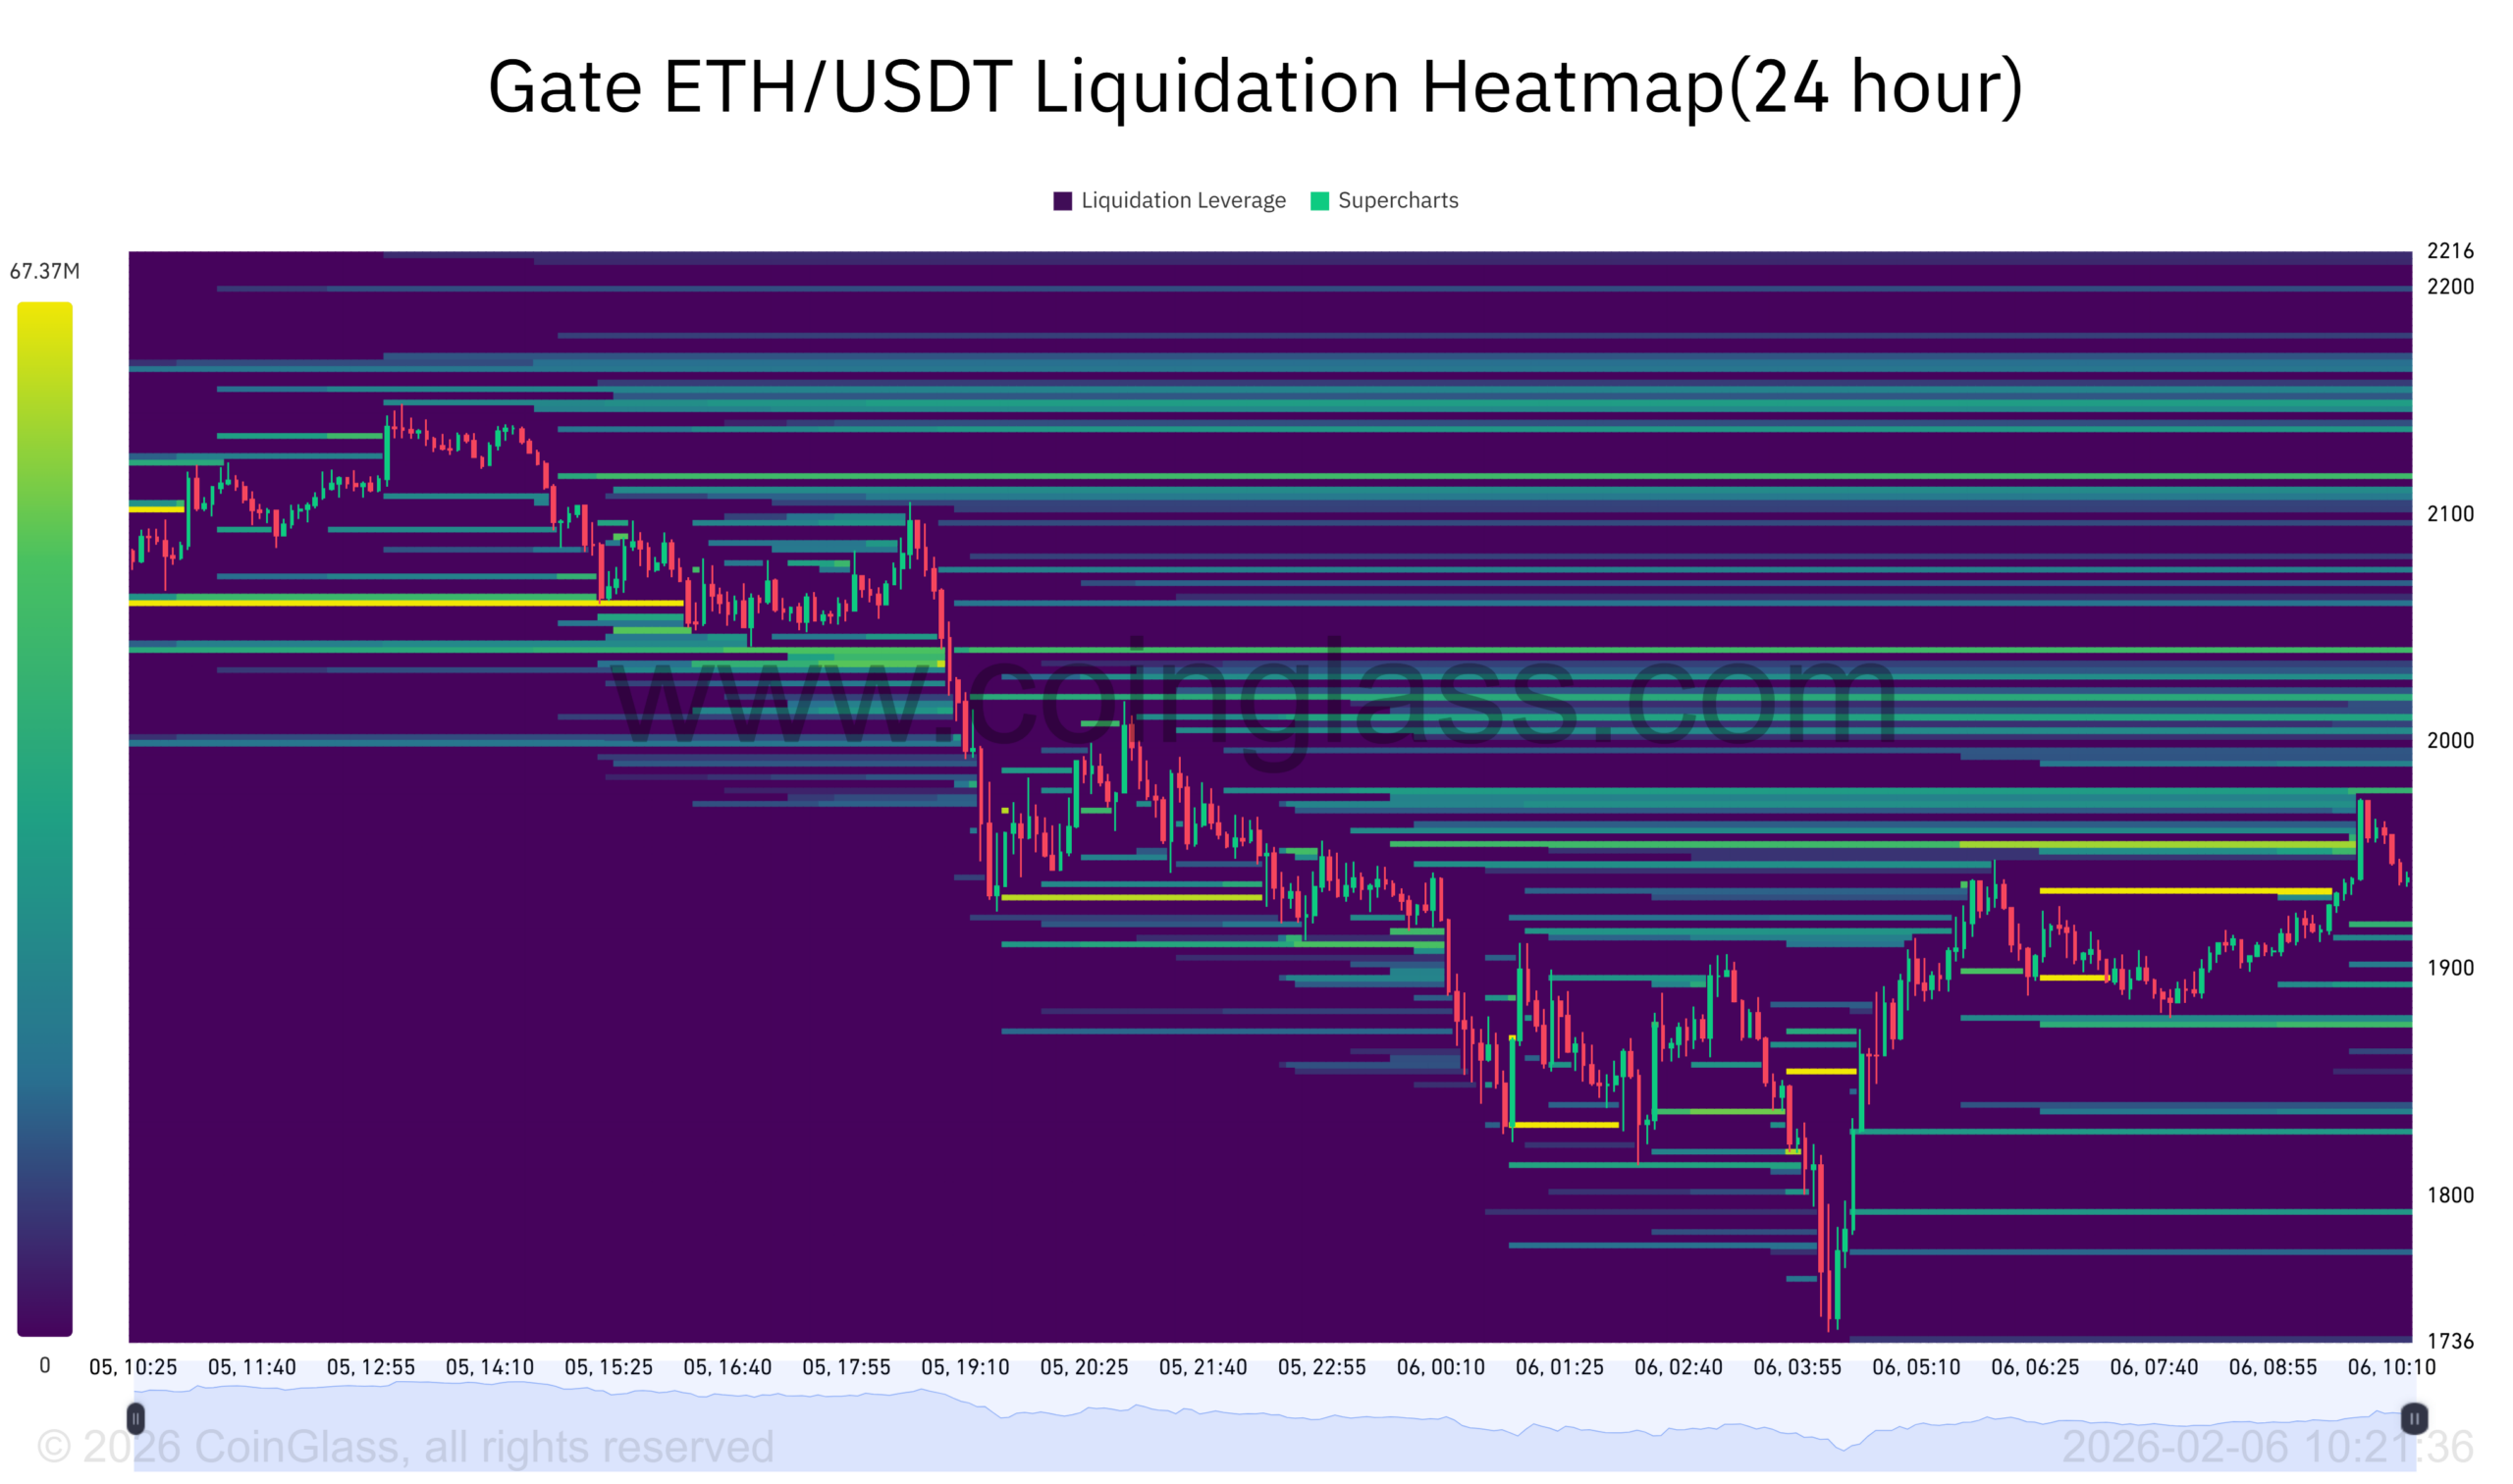
Meanwhile, ETH sold off from the low $2,100s, then slid through the $2,000 area and printed a deeper low near the mid $1,700s before rebounding.
As the drop unfolded, the heatmap shifted activity lower, with fresh bands appearing around $1,900 and then closer to the $1,800 handle.
After the bounce, price moved back toward the high $1,900s, while overhead liquidity remained dense near $2,000 and above.
In turn, the chart left a clear split between nearby bands around the upper $1,900s and larger concentrations still sitting higher in the $2,000 to $2,200 range.
Cryptocurrency and Web3 expert, founder of Kriptoworld
LinkedIn | X (Twitter) | More articles
With years of experience covering the blockchain space, András delivers insightful reporting on DeFi, tokenization, altcoins, and crypto regulations shaping the digital economy.
📅 Published: February 6, 2026 • 🕓 Last updated: February 6, 2026
✉️ Contact: [email protected]
Disclosure:This article does not contain investment advice or recommendations. Every investment and trading move involves risk, and readers should conduct their own research when making a decision.
Kriptoworld.com accepts no liability for any errors in the articles or for any financial loss resulting from incorrect information.
