


Ethereum trades near 3,256 dollars while the chart shows price sitting directly inside the Fibonacci golden zone, a range that often acts as a decision point after large moves.
The 0.5 level sits around 3,535 dollars and the 0.618 level sits near 3,224 dollars.
Stay ahead in the crypto world – follow us on X for the latest updates, insights, and trends!🚀
ETH is holding above the 0.618 retracement, which places the market exactly inside the area where trend reversals frequently begin.
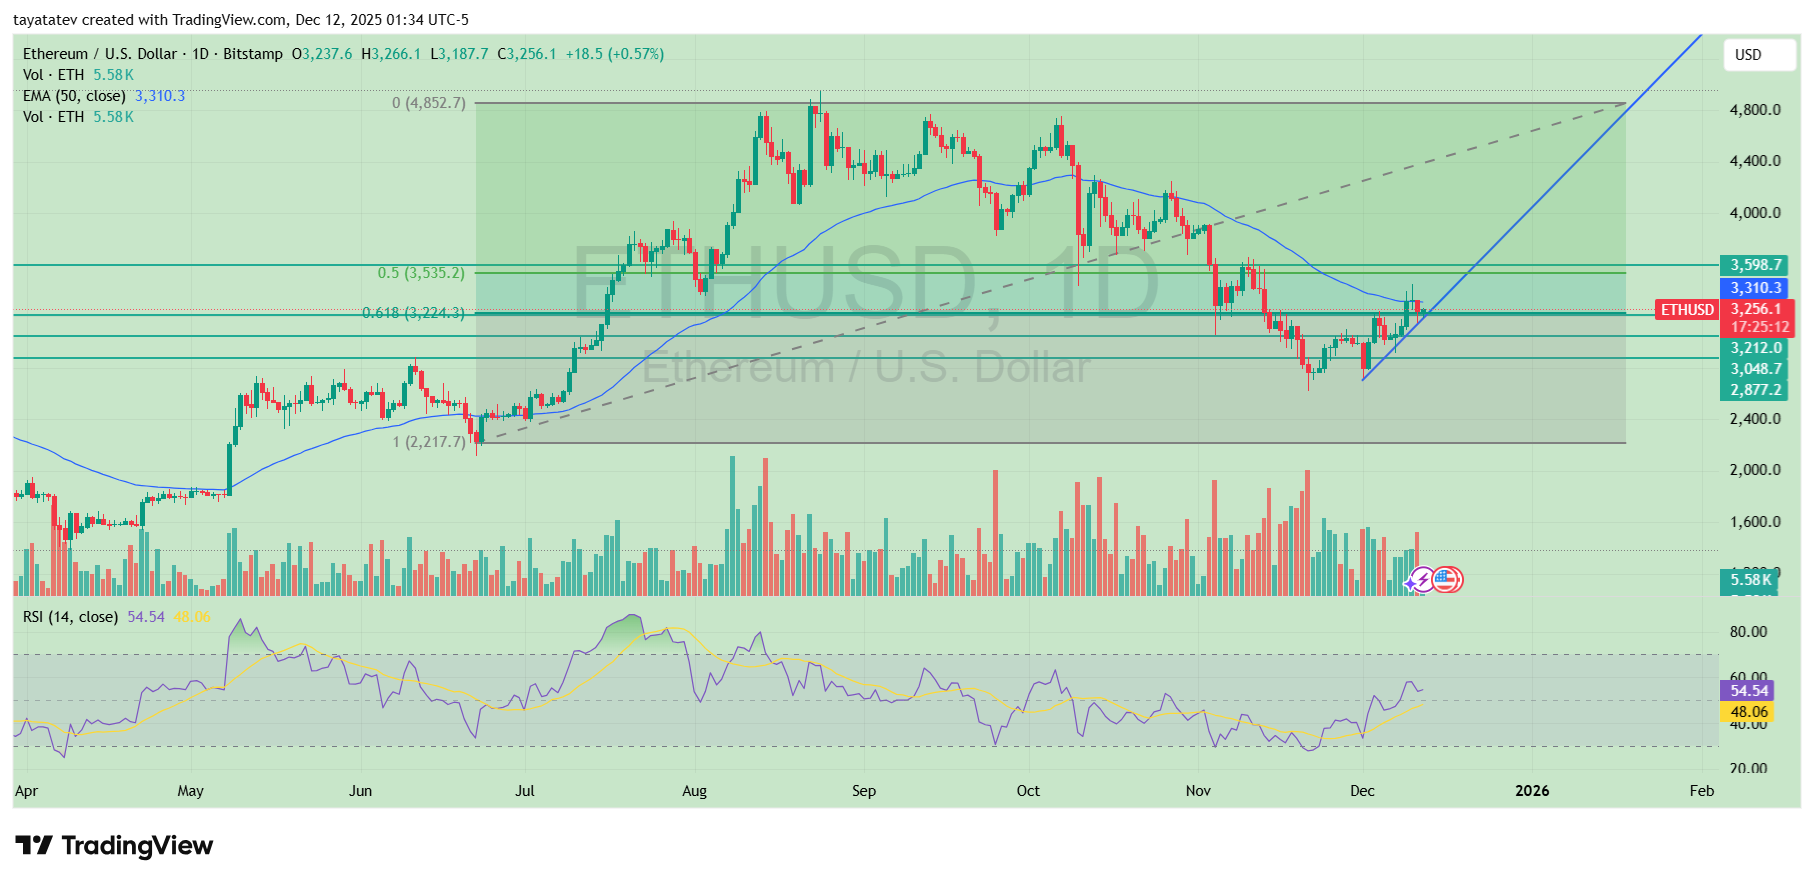
The price reclaimed the short-term rising trendline earlier this week. That move followed a clean bounce from the 3,048 to 2,877 dollar demand zone, which marked the lowest point of the recent decline.
Since then, ETH has printed higher lows, signaling the first coordinated shift in structure since October’s breakdown.
The chart also shows ETH testing the 50 day EMA near 3,310 dollars. A daily close above this level would place price above both the golden zone midpoint and the trendline, which strengthens the case that a reversal is already underway.
Volume remains steady rather than speculative, indicating that the move forms on sustained participation instead of short-term spikes.
If ETH pushes through 3,300 dollars with continued follow-through, the structure opens room toward 3,535 dollars, the next Fibonacci marker.
Clearing that level would confirm a full rebound from the retracement zone and could extend the move toward the prior resistance cluster near 3,850 dollars.
However, as of now, the chart shows price respecting the golden zone and turning upward from it, which supports the early reversal signal already visible on the daily timeframe.
RSI sits near 54, showing momentum shifting out of oversold conditions and into a neutral-to-positive stance.
That aligns with how price behaves when a reversal begins but has not yet reached acceleration levels.
Together, the trendline bounce, Fibonacci zone support and improving momentum outline a clear early-stage trend recovery.
ETH Forms Potential Evening Doji Star as Rally Stalls
Ethereum trades near 3,200 dollars while its daily chart shows a possible evening doji star pattern at the top of the latest advance.
The formation appears after a strong white candle, followed by a small indecisive doji, and then a clear bearish candle.
Together, these three candles signal that buyers are losing control after a sharp push higher.
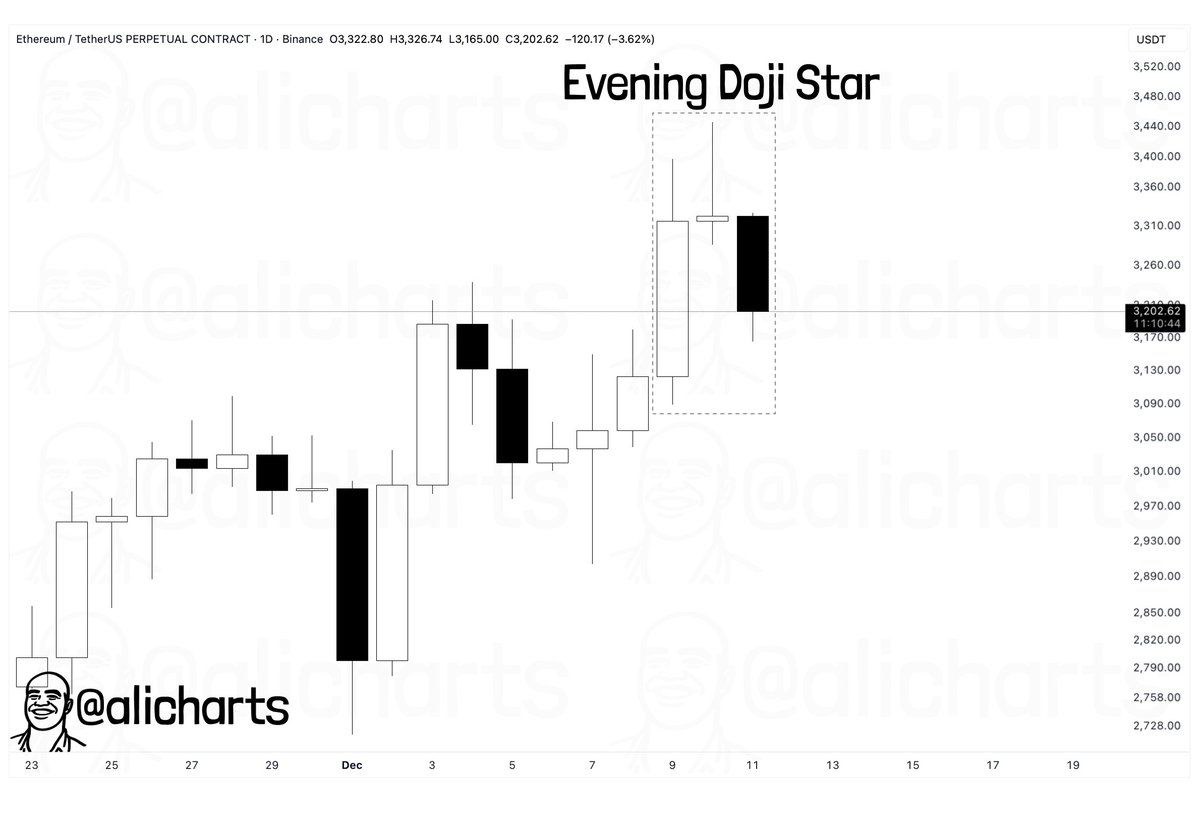
The pattern developed after ETH climbed from the late-November lows into the 3,400 to 3,500 dollar area.
The tall white candle marked strong momentum, but the doji that followed showed price opening and closing near the same level, which often reflects hesitation.
The next session produced a solid black candle that pushed back into the prior range, confirming that sellers finally stepped in with more conviction.
If ETH closes below the low of the doji and continues to trade under the recent peak, the evening doji star would fully confirm and increase the risk of a deeper pullback.
However, as long as price holds above the nearby support band around 3,100 dollars, the pattern only warns that upside momentum is fading rather than guaranteeing a trend change.
Traders now watch how ETH behaves around that support to see whether the market digests gains or starts a broader correction.
Disclosure:This article does not contain investment advice or recommendations. Every investment and trading move involves risk, and readers should conduct their own research when making a decision.
Kriptoworld.com accepts no liability for any errors in the articles or for any financial loss resulting from incorrect information.

Tatevik Avetisyan is an editor at Kriptoworld who covers emerging crypto trends, blockchain innovation, and altcoin developments. She is passionate about breaking down complex stories for a global audience and making digital finance more accessible.
📅 Published: December 12, 2025 • 🕓 Last updated: December 12, 2025
