


Ethereum traded in a tight range on the 4 hour ETHUSD chart, showing continued consolidation after weeks of compressed price action.
At the time the chart was created on Jan. 1, 2026, ETH hovered near the $2,980 area, holding just above short term support while failing to reclaim higher resistance zones.
Stay ahead in the crypto world – follow us on X for the latest updates, insights, and trends!🚀
Volume stayed muted, which reinforced the view that the market remains in a waiting phase rather than a directional move.

The structure on the chart shows a clear rising wedge pattern. A rising wedge forms when price makes higher lows and higher highs, but the trendlines converge, signaling weakening upside momentum.
In many cases, this pattern resolves to the downside once support breaks, as buyers lose control despite rising prices.
On this chart, Ethereum’s higher lows align with an upward sloping support line, while upside advances remain capped under descending resistance.
For now, Ethereum remains in a consolidation phase inside the wedge. Price continues to compress between the rising support and overhead resistance, with candles clustering around the 50 period EMA.
This behavior suggests balance between buyers and sellers, rather than trend expansion.
The RSI also reflects this state, holding near the mid range and showing no strong momentum push in either direction.
However, the broader context adds downside risk if the pattern confirms. A confirmed breakdown from the rising wedge would imply a measured move that points sharply lower.
Based on the height of the structure, a full downside resolution could send Ethereum roughly 52 percent lower from current levels, targeting the lower liquidity zone near the $1,950 area.
This scenario depends on a decisive loss of wedge support, ideally accompanied by expanding volume.
Until that confirmation occurs, Ethereum remains range bound. The market continues to digest prior volatility, and price action reflects hesitation rather than conviction.
Traders are likely watching for a clear break from consolidation, as the rising wedge structure suggests that once direction is chosen, follow through could be decisive rather than gradual.
Ethereum Stalls Near $3,000 as Daily Chart Shows Prolonged Consolidation
Ethereum continued to trade sideways on the daily ETHUSDT chart, showing little directional progress despite repeated attempts to move higher.
At the time of the snapshot, ETH hovered near the $2,980–$3,030 area, holding below a key resistance band that has capped price since November.
The structure reflects hesitation, with buyers and sellers repeatedly absorbing moves without follow-through.
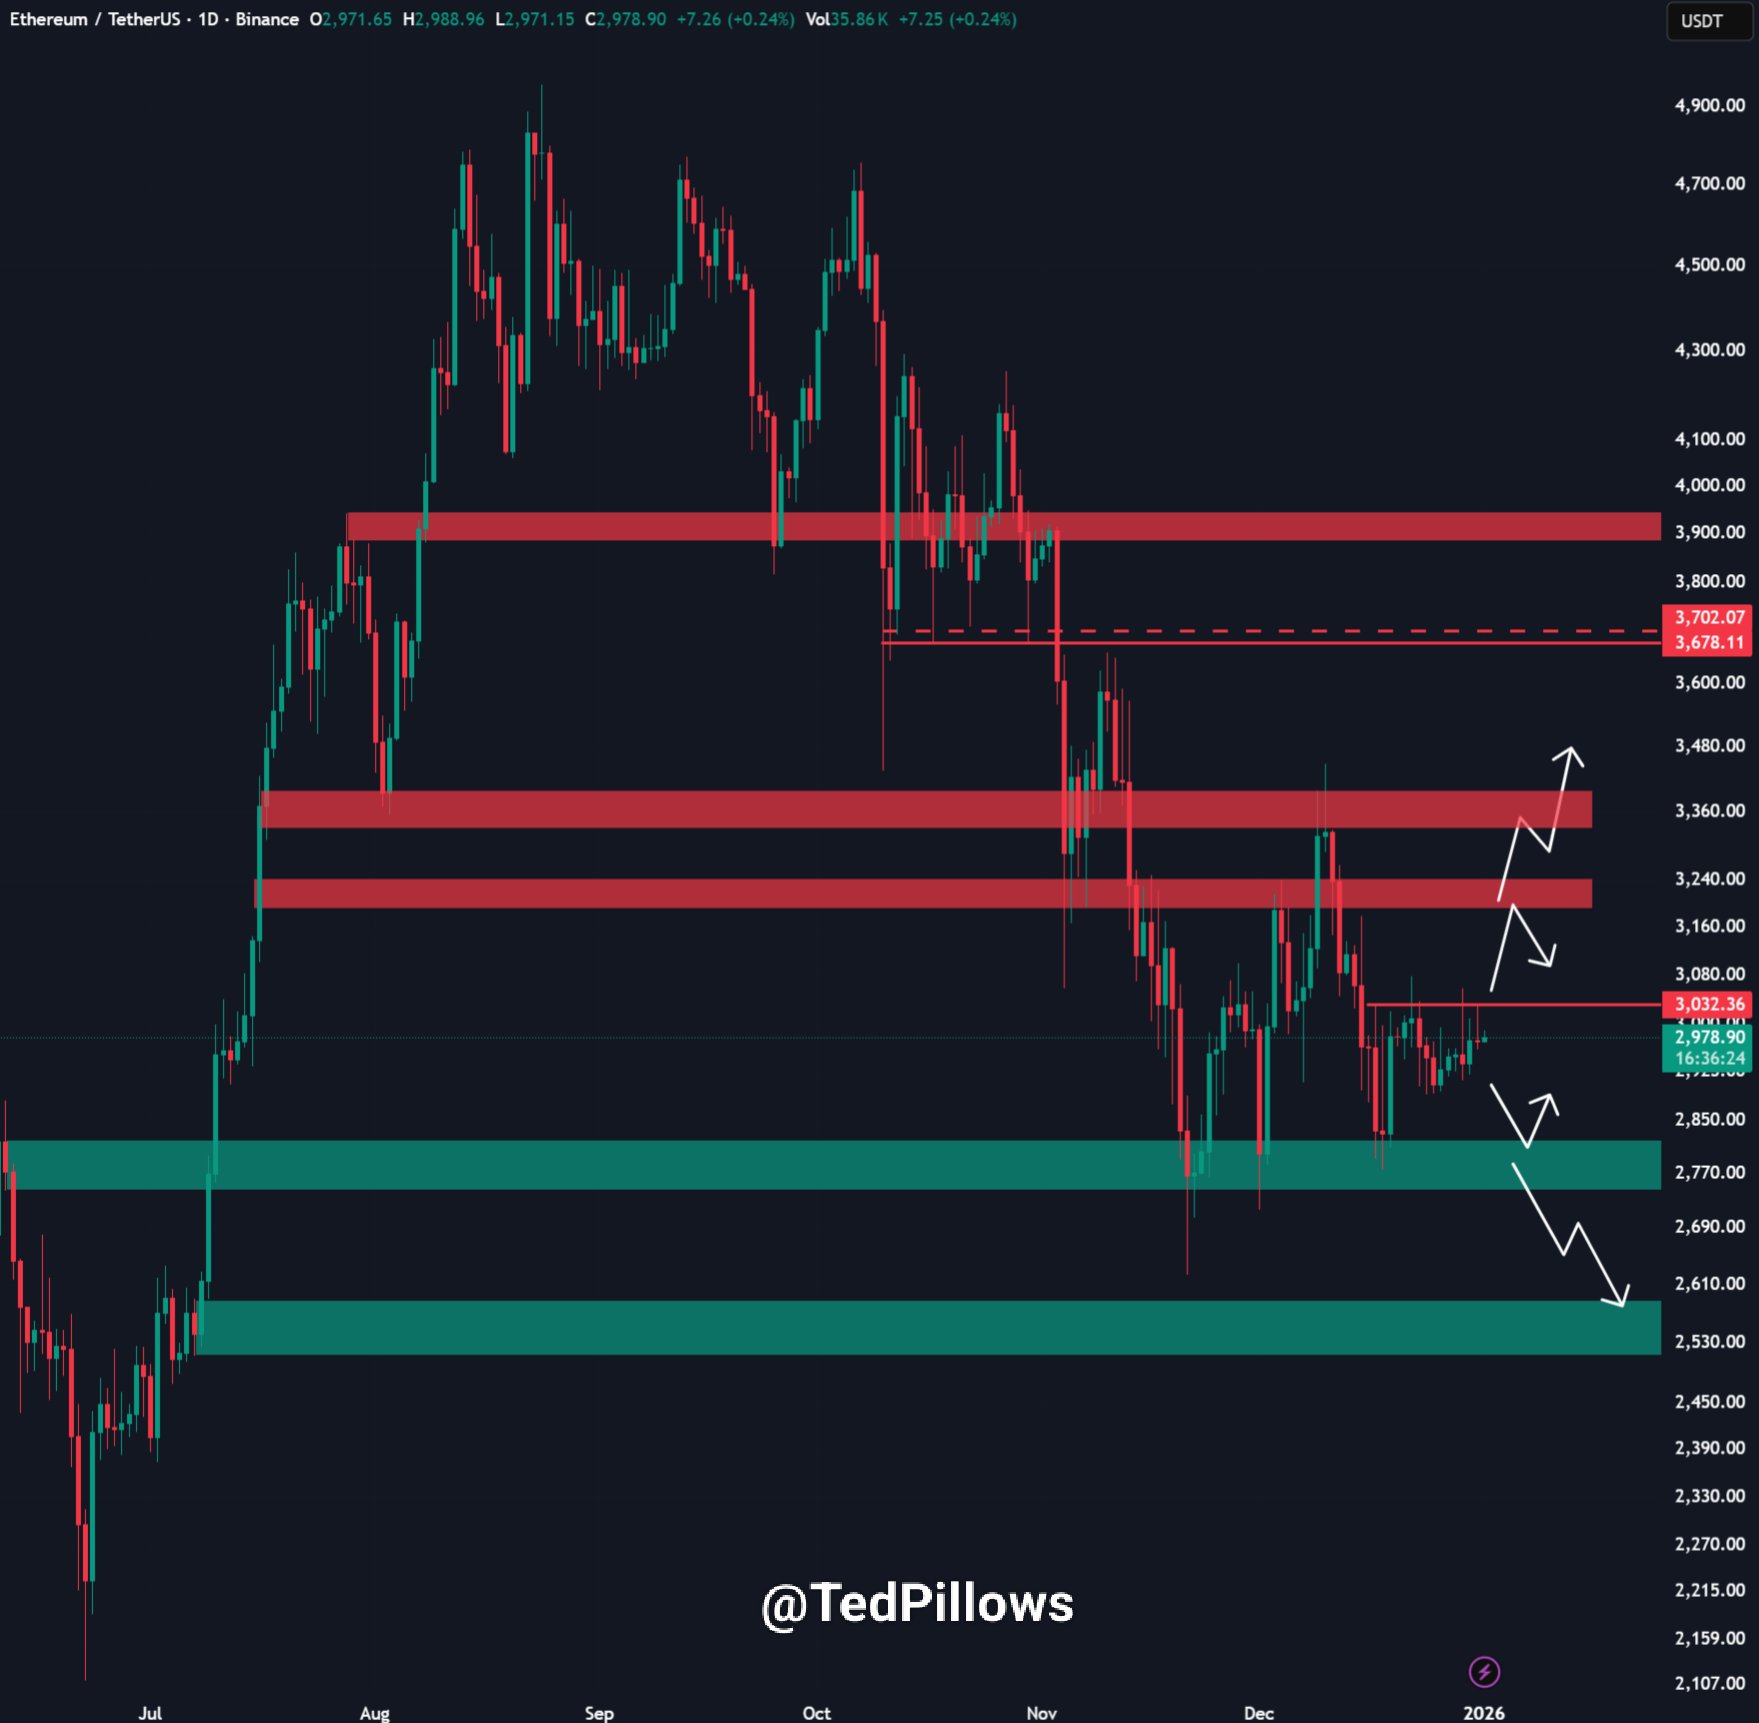
The chart highlights a broad consolidation range forming after a sharp decline from the October highs. Price remains trapped between overhead resistance near the $3,200–$3,350 zone and lower support closer to the $2,750–$2,550 demand area.
This range behavior signals equilibrium, where neither side has gained sustained control.
Each rally into resistance has met selling pressure, while dips toward support have attracted reactive buying.
From a structural perspective, Ethereum is compressing under the psychological $3,000 level. This area has acted as both support and resistance in recent weeks, reinforcing its importance.
As long as daily closes remain below the upper resistance band, upside momentum stays limited. However, repeated tests of the same level also increase the chance of a resolution, as liquidity continues to build.
If Ethereum breaks and holds above $3,000, the chart suggests room for a short-term expansion.
A clean reclaim of resistance could open a path toward the $3,350–$3,500 zone, which aligns with prior supply. In that scenario, upside continuation of roughly 15% to 20% over several weeks would fit the structure shown on the chart.
On the downside, failure to sustain current levels keeps risk tilted lower. A loss of the $2,950–$2,900 area would likely expose Ethereum to a deeper move back into the $2,750 demand zone.
Below that, the chart shows another major support band near $2,550, where previous reactions slowed selling pressure.
For now, Ethereum remains range bound. The daily chart reflects consolidation rather than trend, with price coiling between well-defined zones.
A decisive breakout or breakdown is still required before a clearer directional move develops.
Disclosure:This article does not contain investment advice or recommendations. Every investment and trading move involves risk, and readers should conduct their own research when making a decision.
Kriptoworld.com accepts no liability for any errors in the articles or for any financial loss resulting from incorrect information.

Tatevik Avetisyan is an editor at Kriptoworld who covers emerging crypto trends, blockchain innovation, and altcoin developments. She is passionate about breaking down complex stories for a global audience and making digital finance more accessible.
📅 Published: January 1, 2026 • 🕓 Last updated: January 1, 2026
