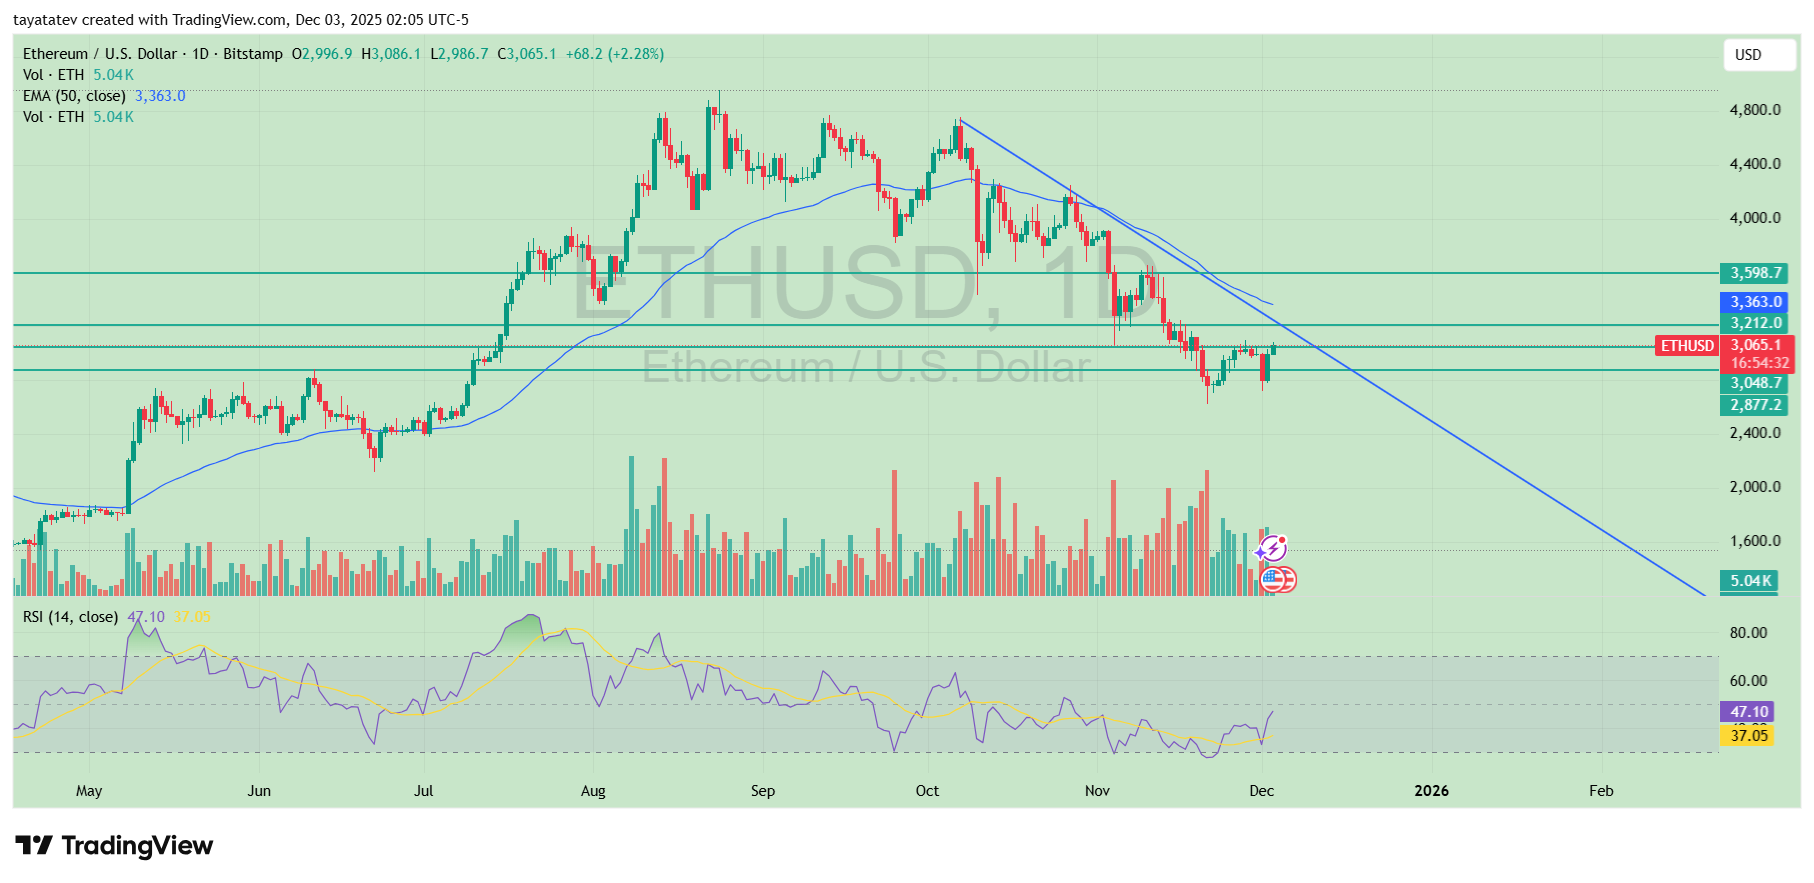
This structure shows that sellers still control the larger move even after the latest rebound.
Ethereum Reversal Test at 3,212. Source: TradingView
However, the chart also shows the first signs of a potential short-term reversal attempt. ETH bounced from the horizontal support zone around 2,877 dollars and has now reclaimed the area near 3,048 dollars.
The daily close at about 3,065 dollars marks a higher low versus the November bottom and pushes price back toward overhead resistance.
At the same time, the RSI has turned up from near oversold levels and now sits around 47, which signals easing downside momentum rather than strong trend strength in either direction.
The key level on this chart sits at 3,212 dollars. This line marks the upper boundary of the current consolidation zone and stands just under the descending trendline.
If ETH breaks and holds above 3,212 dollars on the daily time frame, it would be the first clean close back above a major resistance since the selloff started.
In that case, price could then target the next resistance band near 3,363 dollars at the 50-day EMA, and after that the horizontal supply zone around 3,598 dollars that capped rallies earlier in the year.
Until such a breakout happens, the downtrend remains valid and the recent move counts as a corrective bounce inside it.
Support to the downside stays in the 3,048 to 2,877 dollar zone. A daily close back below that band would warn that sellers have regained control and that the reversal attempt has failed, while a strong move through 3,212 dollars would confirm that bulls finally forced a shift in the short-term structure.
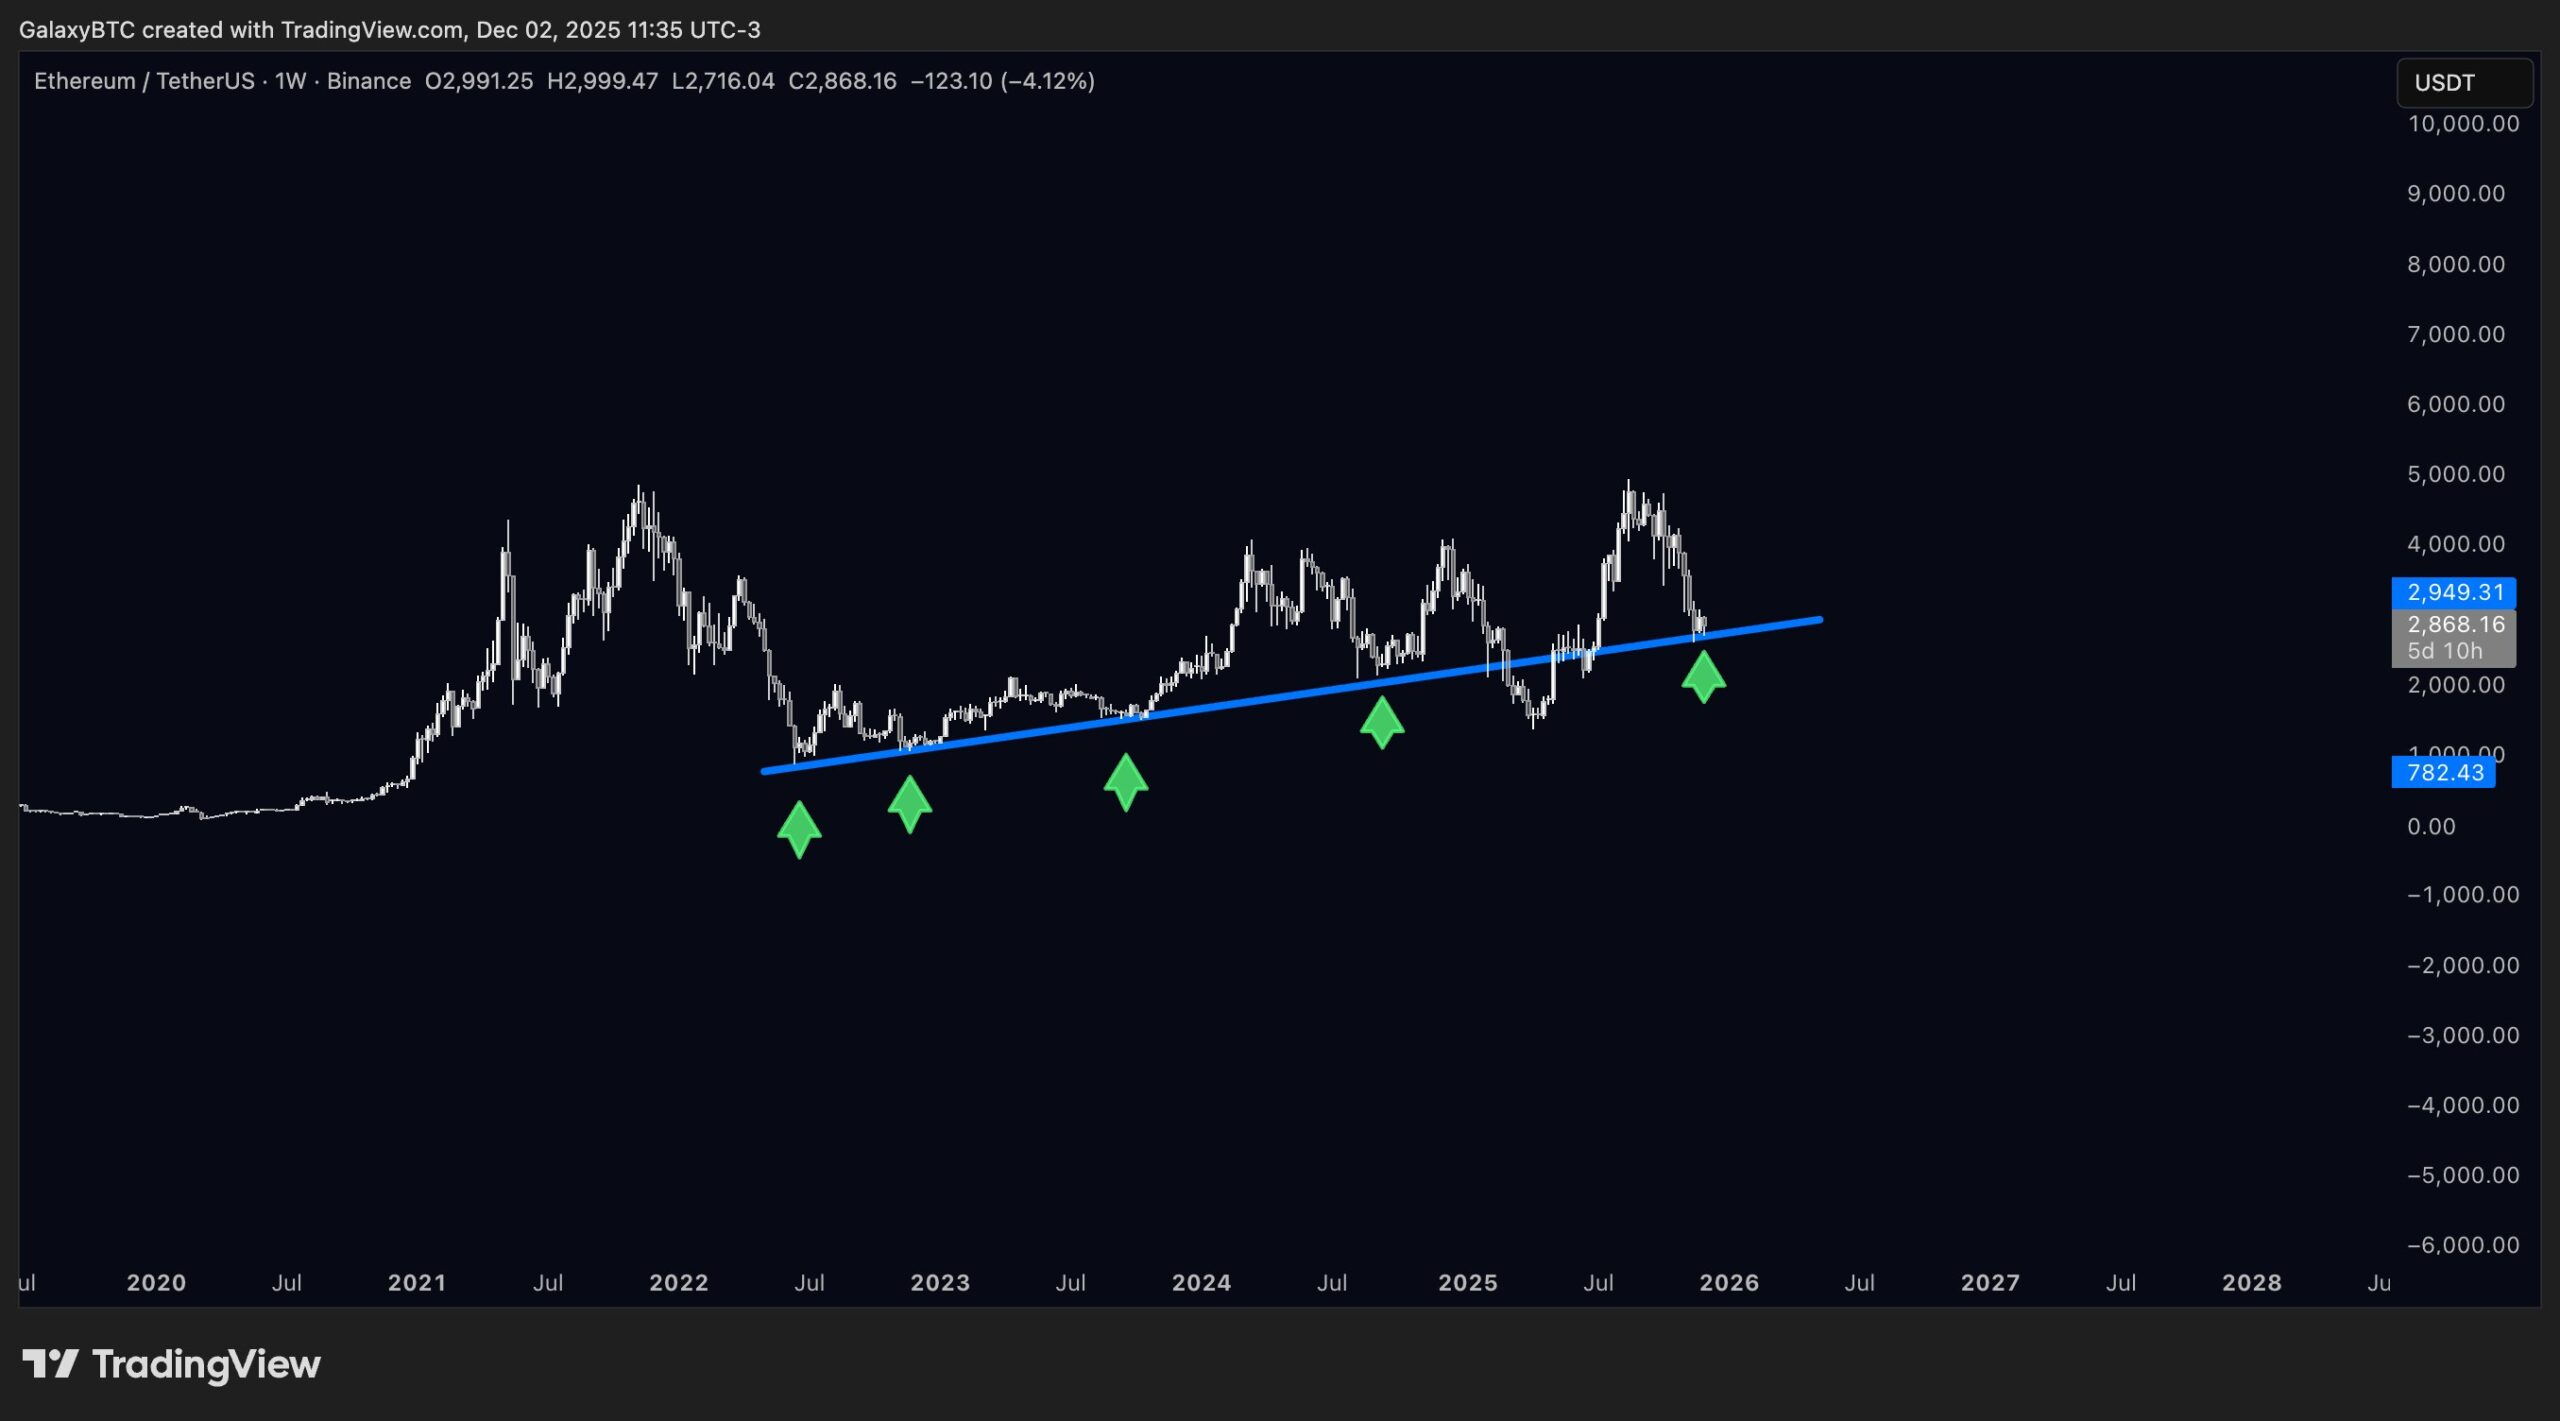
Ethereum Reaches Long-Term Support as Weekly Chart Signals Key Turning Point
Ethereum’s weekly chart from Dec. 2, 2025, shows price touching a long-term rising support line that has guided multiple rebounds since mid-2022.
The trendline, marked by several reaction points, now sits just under the current weekly close near 2,868 dollars on the ETH/USDT Binance pair.
Each previous test of this line produced a sustained upside move, which makes the current touch an important moment for market structure.
Ethereum Long-Term Bull Trendline Test. Source: GalaxyBTC on X
ETH reached this zone after a months-long decline from its mid-2025 peak. However, the weekly structure has not broken its higher-low formation, and price continues to respect the ascending support.
The chart also shows that the broader uptrend stretching over several years remains intact, even though ETH recently lost momentum during the latest correction.
By holding this support again, the asset enters a region where buyers have historically returned, and where long-term demand often stabilizes price.
As ETH trades above the trendline, the market watches whether this reaction repeats the past pattern.
A clean weekly close above the support strengthens the case for a continuation bounce, while any sustained break below would mark a structural shift.
Until that happens, the chart signals that ETH has reached a crucial level that has repeatedly triggered new legs of bullish price action.
Disclosure:This article does not contain investment advice or recommendations. Every investment and trading move involves risk, and readers should conduct their own research when making a decision.
Kriptoworld.com accepts no liability for any errors in the articles or for any financial loss resulting from incorrect information.
Tatevik Avetisyan is an editor at Kriptoworld who covers emerging crypto trends, blockchain innovation, and altcoin developments.
She is passionate about breaking down complex stories for a global audience and making digital finance more accessible.
📅 Published: December 3, 2025 • 🕓 Last updated: December 3, 2025
While the crypto market panics, Bitcoin Cash is thriving. BCH has set multiple records in February despite extreme market fear.
The network has seen increased...
Bitcoin traded near $66,505 on the 15-minute BTCUSD index chart as price continued to slide within a descending channel.
The move followed a failed bounce...