


A new spot XRP exchange-traded fund (ETF) from CanaryCap is set to begin trading on November 13, 2025, according to an update shared by crypto researcher Ripple Bull Winkle on X.
The announcement follows a wave of XRP-related ETF filings from major asset managers.
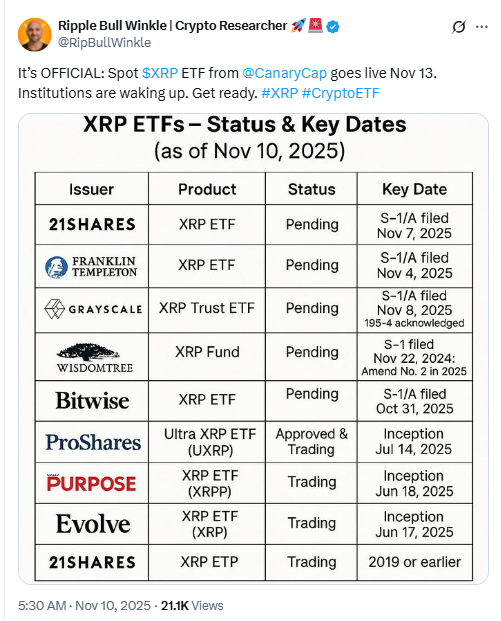
The shared table highlights the current status of multiple XRP ETF applications. Firms such as 21Shares, Franklin Templeton, Grayscale, WisdomTree, and Bitwise all have pending S-1 or S-1/A filings with the U.S. Securities and Exchange Commission. Their submission dates range between October 31 and November 8, 2025.
Meanwhile, three XRP-related ETFs are already trading. ProShares launched its Ultra XRP ETF (UXRP) on July 14, 2025.
Purpose and Evolve began trading their XRP ETFs in mid-June 2025. 21Shares also operates an XRP exchange-traded product (ETP) active since 2019 or earlier.
The upcoming CanaryCap launch marks the latest addition to the growing list of XRP-focused ETFs and funds that signal expanding institutional interest in the cryptocurrency sector.
Stay ahead in the crypto world – follow us on X for the latest updates, insights, and trends!🚀
XRP Forms Bullish Flag, Analyst Sees Potential Rally Toward $10
Crypto analyst Ali shared a chart suggesting that XRP may be shaping a bullish flag pattern.
The setup shows XRP consolidating between roughly $1.90 and $2.80 after a sharp advance earlier in 2025.
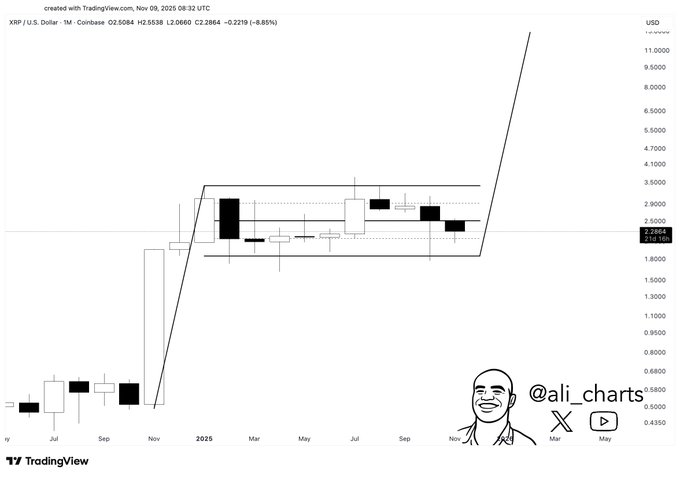
In the chart, the consolidation appears as a rectangular flag following a steep price surge — a structure often viewed as a continuation signal in technical analysis.
A temporary dip to around $1.90 could complete the pattern and set the stage for another breakout.
Ali noted that if XRP maintains support within this range, a rebound could trigger a strong upward move, potentially targeting the $10 area.
The analysis implies that XRP’s long-term momentum remains intact despite the short-term correction.
XRP Breaks Out of Falling Wedge on 4-Hour Chart
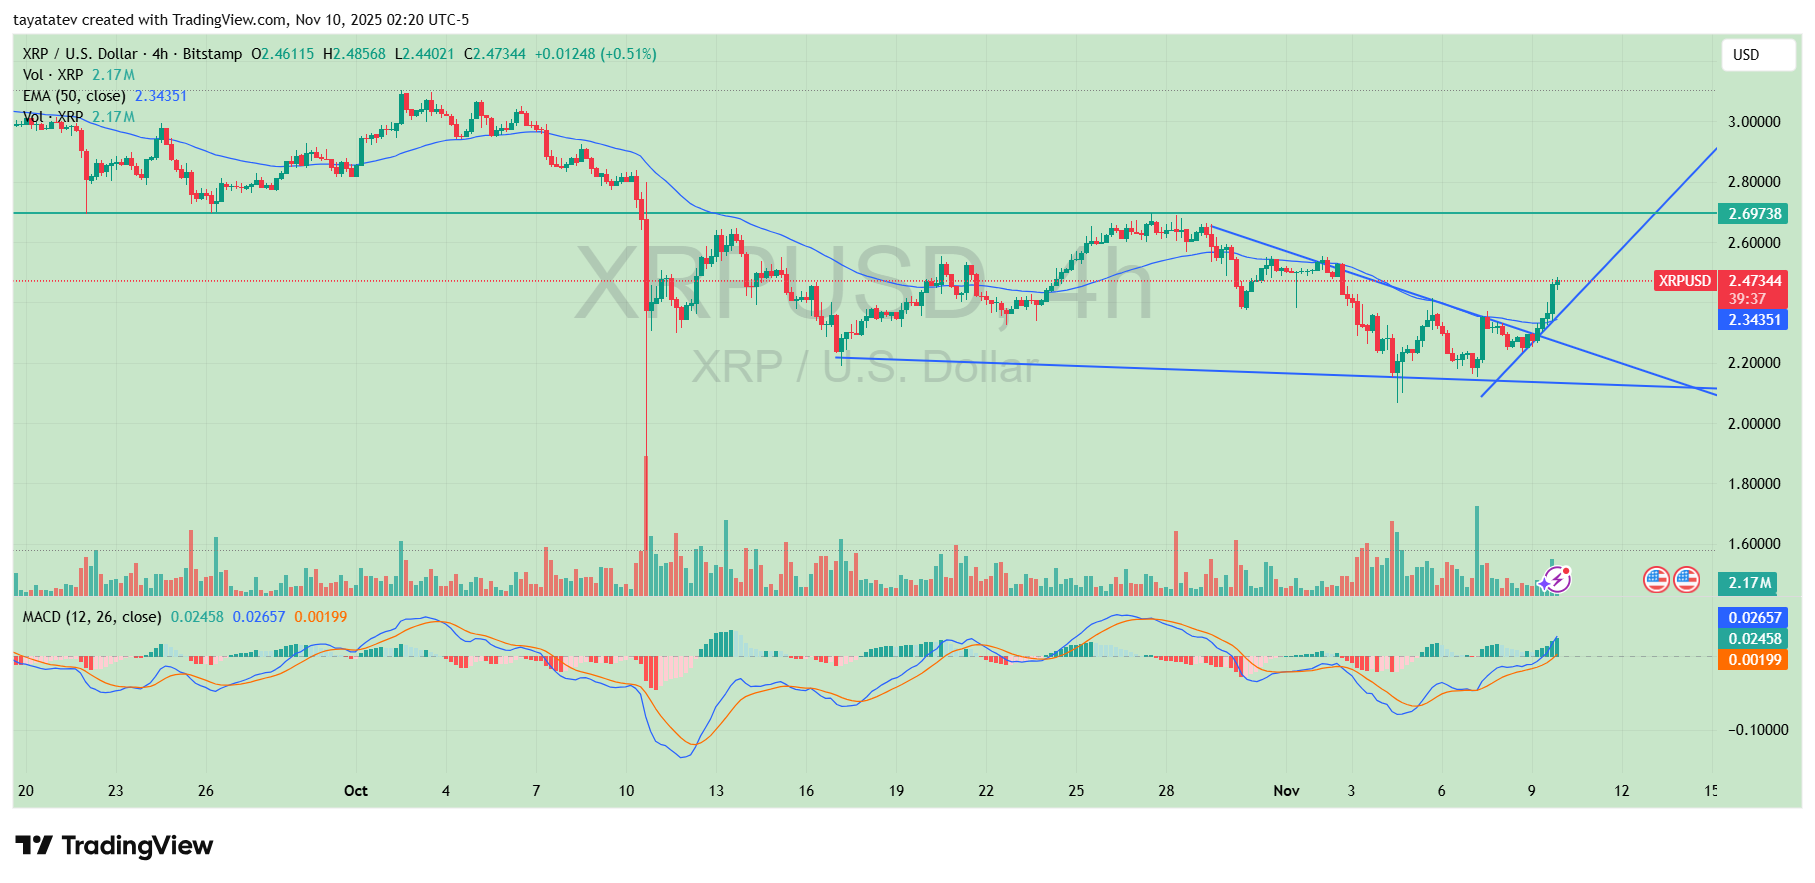
The 4-hour XRP/USD chart from Bitstamp, created on Nov. 10, 2025, shows price breaking out of a falling wedge pattern.
The wedge started forming in late October 2025, after XRP failed to hold above the mid-$2.70 area and began making lower highs and slightly lower lows inside two converging blue trendlines.
A falling wedge pattern appears when price declines within narrowing support and resistance lines.
Each downswing becomes smaller than the previous one, so the range compresses as the lines move closer together.
In classical technical analysis, this structure often signals that downside pressure is slowing while buyers gradually absorb supply, setting up a potential upside resolution once price pierces the upper boundary.
On this chart, XRP has already moved out of the wedge. Price has broken above the descending blue resistance line and now trades near $2.47, moving away from the lower boundary that previously guided the decline.
At the same time, XRP has reclaimed the 50-period exponential moving average around $2.34, which now runs below spot price and acts as short-term support.
The breakout path on the chart points toward the next horizontal resistance at about $2.69. The projected blue uptrend line from the recent low also frames this move, showing an upward channel from which XRP is advancing.
As long as price stays above the broken wedge resistance and does not fall back to touch that lower blue line again, the structure indicates ongoing bullish action toward the $2.69 area, where traders will watch how XRP reacts to that resistance zone.
Disclosure:This article does not contain investment advice or recommendations. Every investment and trading move involves risk, and readers should conduct their own research when making a decision.
Kriptoworld.com accepts no liability for any errors in the articles or for any financial loss resulting from incorrect information.

Tatevik Avetisyan is an editor at Kriptoworld who covers emerging crypto trends, blockchain innovation, and altcoin developments. She is passionate about breaking down complex stories for a global audience and making digital finance more accessible.
📅 Published: November 10, 2025 • 🕓 Last updated: November 10, 2025
