

 Flashes Double Warning as Analysts Flag Support Risk and Trendline Breakdown (1)")
Dogecoin faces two major technical red flags as analysts point to weakening support and a broken long-term trendline.
At the same time, fresh chart signals show momentum fading, raising questions about where buyers might step in next.
Dogecoin Analyst Flags $0.14–$0.13 as Key Daily Support Zone
Dogecoin is drifting toward a technical demand area between $0.14 and $0.13 on the daily chart, according to trader FibonacciTrading on X.
The analyst views this band as a critical zone where buyers have previously stepped in to slow downside moves.
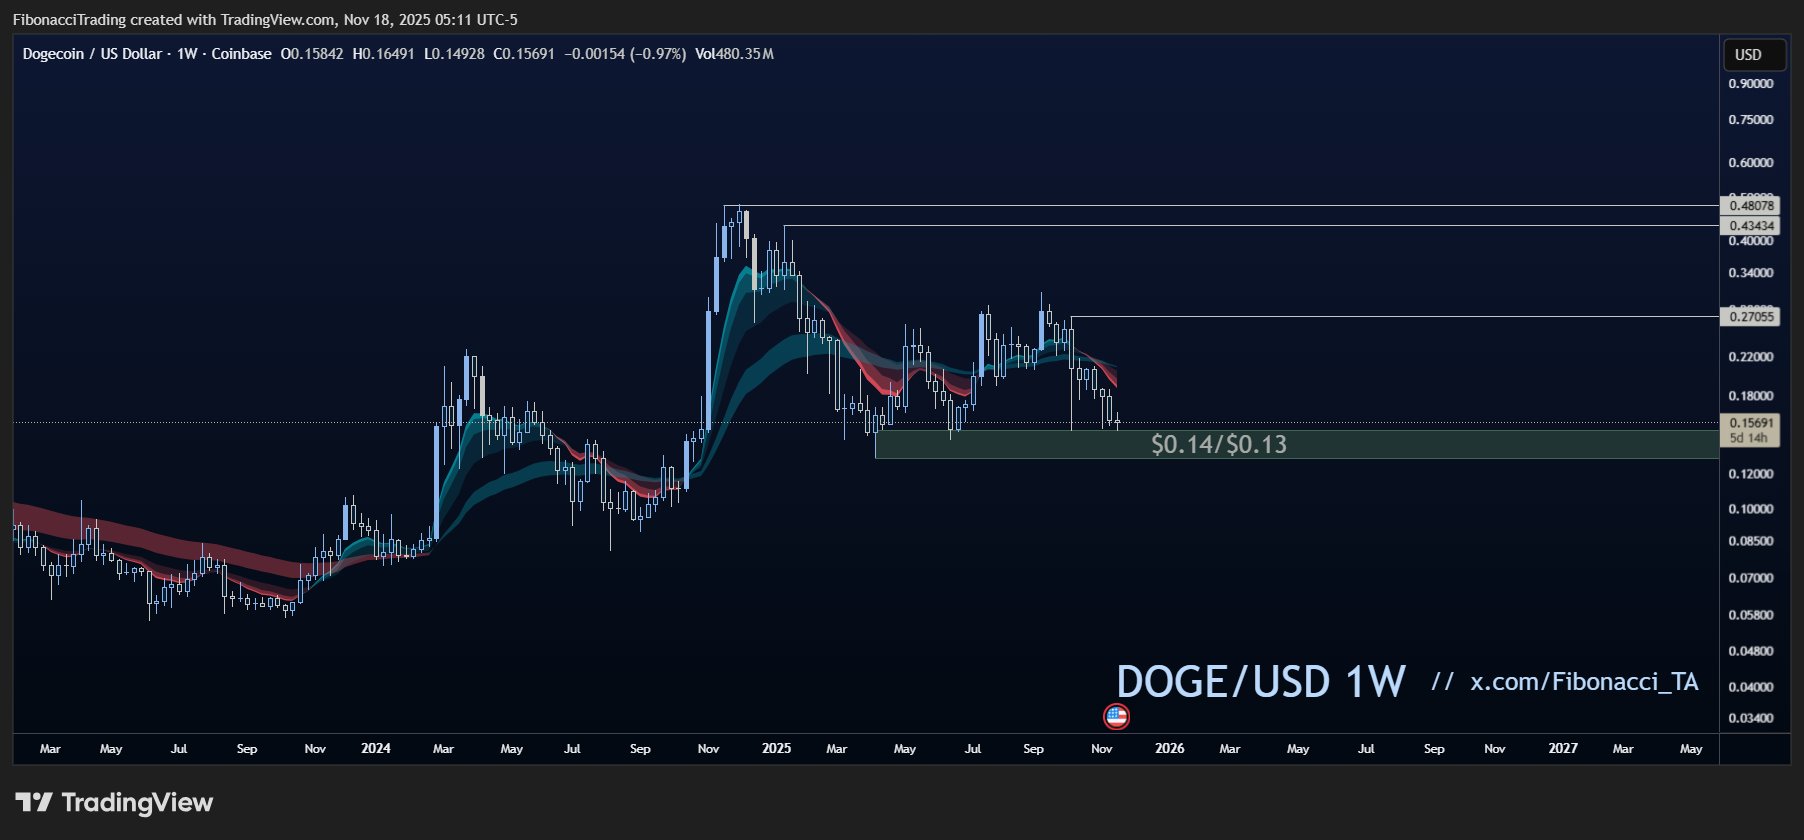
In the post, FibonacciTrading said the $0.14–$0.13 range is the area “to place bets” with a tight stop just below, framing it as a level where risk can be defined for short-term strategies.
The comment underscores how closely traders are watching whether the zone attracts fresh demand.
The analyst added that market participants should “let price come to you and then let the reaction decide” if the move becomes “just another fade or the start of a real bounce.”
The focus now turns to whether Dogecoin can stabilize in this support region or extend its current slide.
Dogecoin Breaks Long-Term Trendline as Analyst Warns of Further Weakness
Meanwhile, Dogecoin slipped below a multi-month ascending trendline that has guided the token’s broader structure since mid-2023, according to analyst Ali on X.
The chart shows three major bounces along the trendline before the latest breakdown, which now places the $0.15 area back in focus.
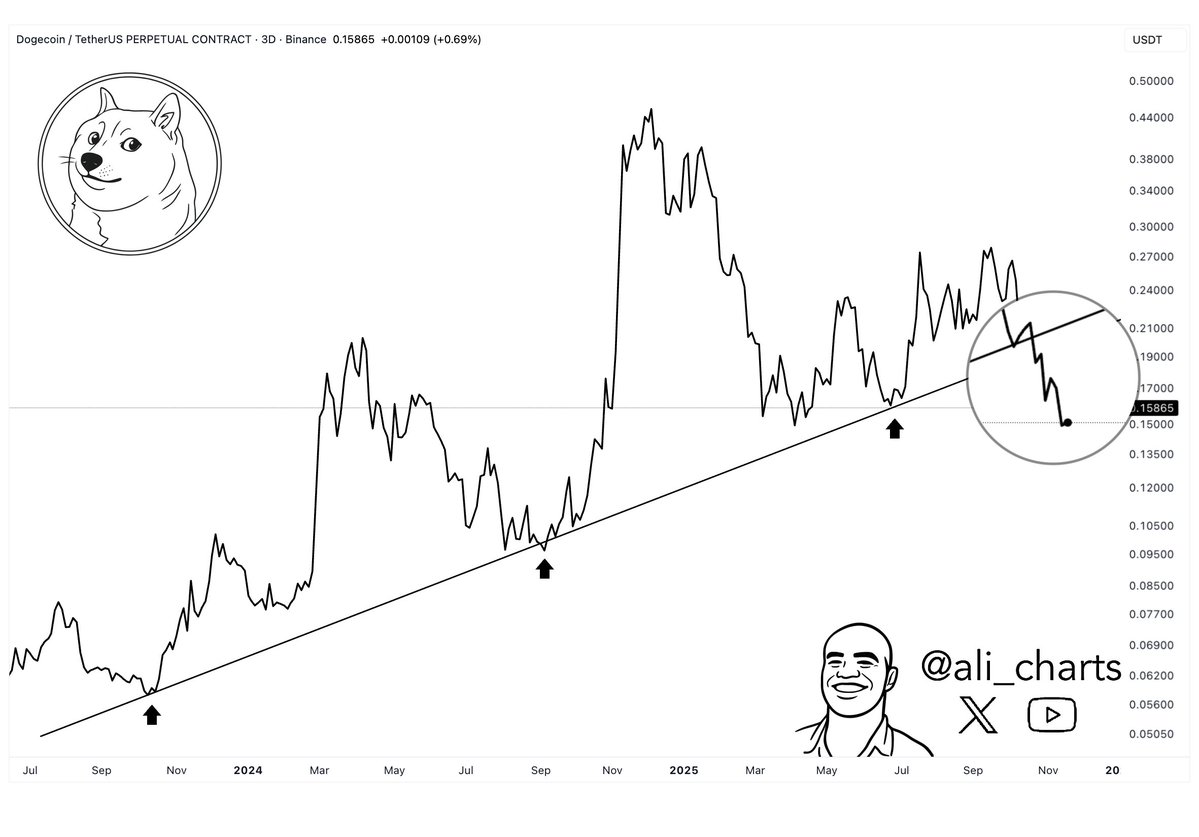
Ali posted the update with the remark “This is NOT good,” highlighting how the clean breach changes the character of the trend.
The drop below the line follows a series of lower highs on the three-day chart, indicating fading momentum after months of sideways consolidation.
The analysis points to a potential shift in market behavior as Dogecoin trades under a support level that previously acted as a foundation for rallies.
Market attention now turns to whether buyers can reclaim the trendline or if the breakdown reinforces a deeper corrective phase.
Disclosure:This article does not contain investment advice or recommendations. Every investment and trading move involves risk, and readers should conduct their own research when making a decision.
Kriptoworld.com accepts no liability for any errors in the articles or for any financial loss resulting from incorrect information.

Tatevik Avetisyan is an editor at Kriptoworld who covers emerging crypto trends, blockchain innovation, and altcoin developments. She is passionate about breaking down complex stories for a global audience and making digital finance more accessible.
📅 Published: November 18, 2025 • 🕓 Last updated: November 18, 2025
