


XRP continued its downtrend on Dec. 2, 2025, as the daily chart showed the token trading near $2.01 while staying firmly under its long-term descending blue trendline.
The market has not shown any sign of reversal because XRP must break and hold above that line before traders can confirm a shift in trend. Until that happens, momentum remains pointed lower.
Stay ahead in the crypto world – follow us on X for the latest updates, insights, and trends!🚀
XRP failed to reclaim the Fibonacci golden zone between $2.55 (0.618) and $2.74 (0.5) after the July peak near $3.55. Price entered that zone once in late summer; however, sellers rejected the move quickly.
As a result, the area now acts as a heavy ceiling that blocks upward attempts. The chart shows the failure at the Fibonacci layer and the continued slide beneath it as selling pressure grows.
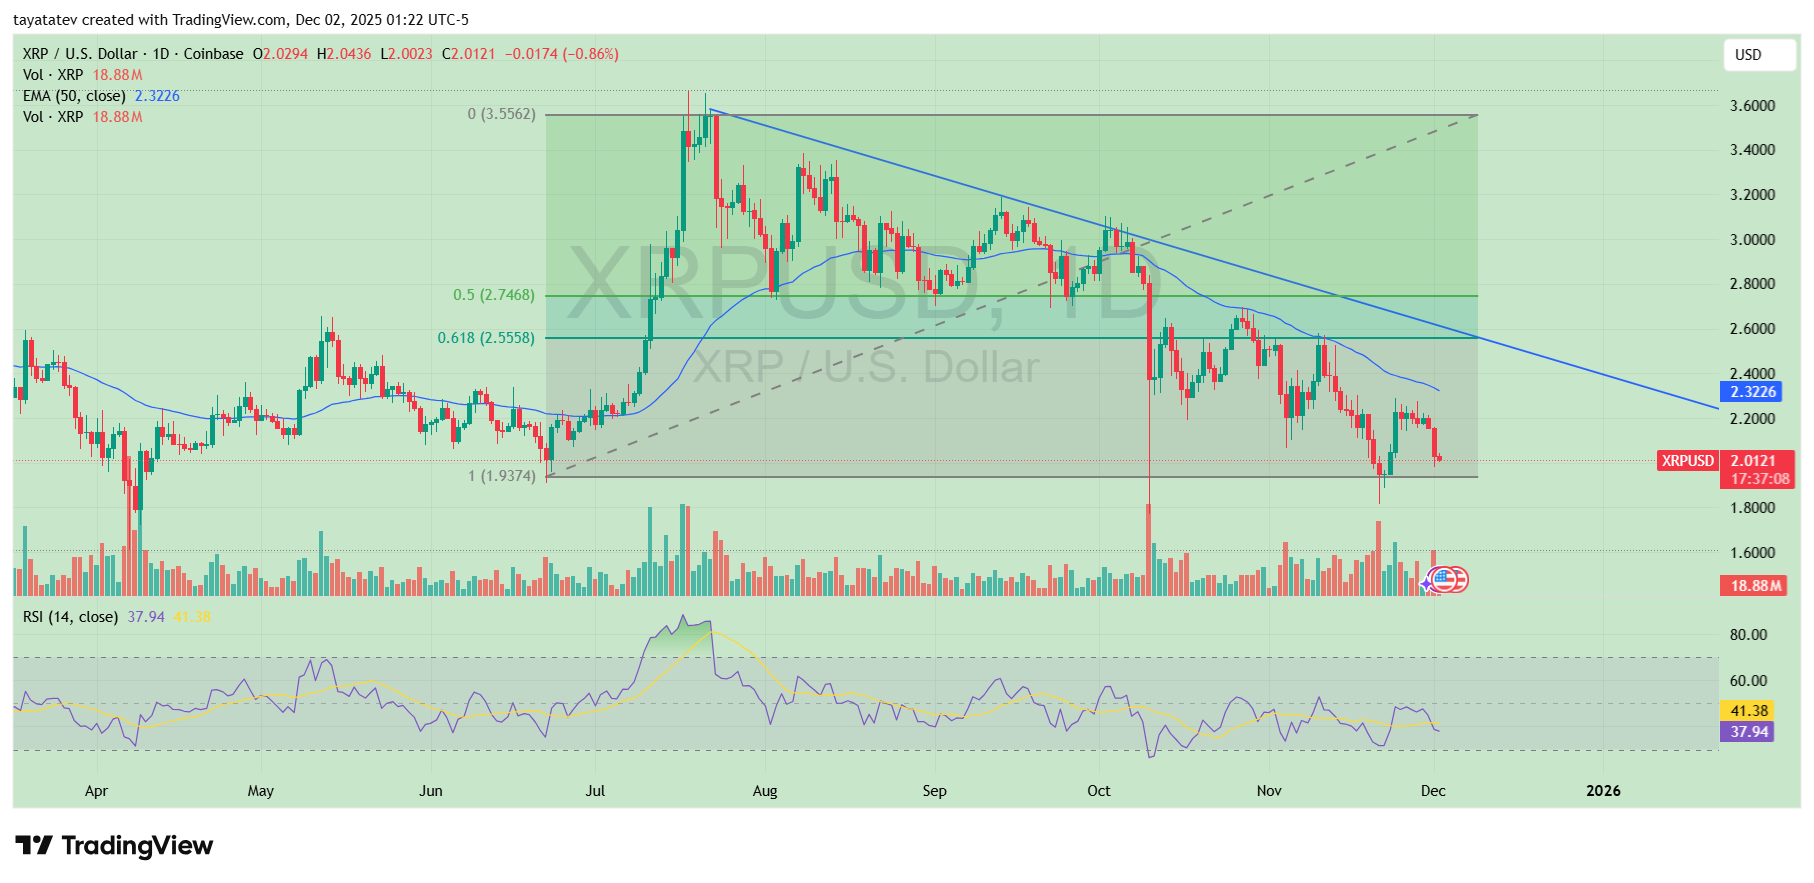
In addition, the lower Fibonacci level at $1.93 remains the main support zone from the previous impulse.
XRP has bounced above this range several times, yet the reactions stay weak.
Because price trades between the Fibonacci resistance band and that support floor, the structure leans bearish until bulls reclaim decisive levels.
The 50-day EMA near $2.32 slopes downward and aligns with the blue trendline. Each time XRP approaches this moving average, sellers step in and force a new swing lower.
Therefore, the EMA reinforces the downtrend and marks the first technical barrier that buyers must overcome before testing the trendline resistance. As long as XRP stays below it, momentum favors continued lower highs.
The declining shape of the EMA also shows weakening demand. Every rally has struggled to close above this line since September, and volume does not support strong break attempts. This keeps the short-term tone aligned with the broader downtrend.
The RSI sits near 38, showing bearish momentum without being oversold. The indicator has not broken above the midline since early November. Therefore, momentum remains weak and does not support a trend reversal.
If the RSI climbs above 50, it may signal a shift, but for now it confirms the downtrend shown on the chart. Until RSI flips above its trend of lower peaks, traders see limited strength behind any bounce.
XRP Slides Toward Support After Losing Structure at 2.82
XRP extended its decline after losing structure near $2.82, according to a chart shared on X by the analyst BitGuru.
The token had rallied sharply in July before shifting into a long consolidation phase where price repeatedly failed to break above the upper range.
Each attempt produced lower highs, signaling weakening momentum as the market moved sideways.
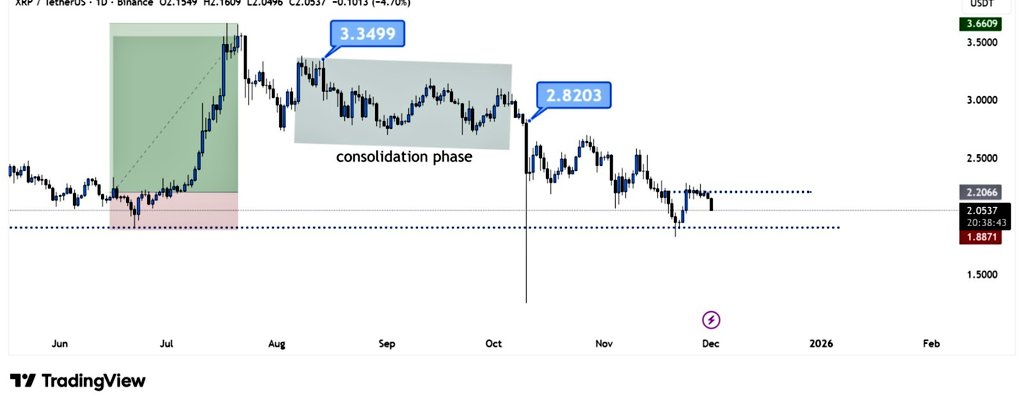
As the consolidation matured, sellers regained control. The break below $2.82 marked the turning point that shifted XRP into a steady downtrend. Since then, price has continued to post lower highs and lower lows, reinforcing the bearish structure.
The current move places XRP near a key horizontal support zone highlighted on the chart. That level has acted as a reaction area several times in past months.
However, the market remains pressured because buyers have not reclaimed the upper consolidation band.
Until XRP closes back above that range, the broader structure stays bearish and keeps risk tilted to the downside.
The chart shows no confirmed reversal pattern yet, and the token continues to trade near the lower boundary of its recent range as of early December.
Disclosure:This article does not contain investment advice or recommendations. Every investment and trading move involves risk, and readers should conduct their own research when making a decision.
Kriptoworld.com accepts no liability for any errors in the articles or for any financial loss resulting from incorrect information.

Tatevik Avetisyan is an editor at Kriptoworld who covers emerging crypto trends, blockchain innovation, and altcoin developments. She is passionate about breaking down complex stories for a global audience and making digital finance more accessible.
📅 Published: December 2, 2025 • 🕓 Last updated: December 2, 2025
