


XRP traded near $2.10 on the daily XRPUSD chart on Coinbase on Jan. 15, slipping about 1.75% on the session as price stayed below a long, falling trendline that has capped rallies since the mid year peak.
The chart keeps XRP in a downtrend overall, even after a recent bounce from late 2025 lows.
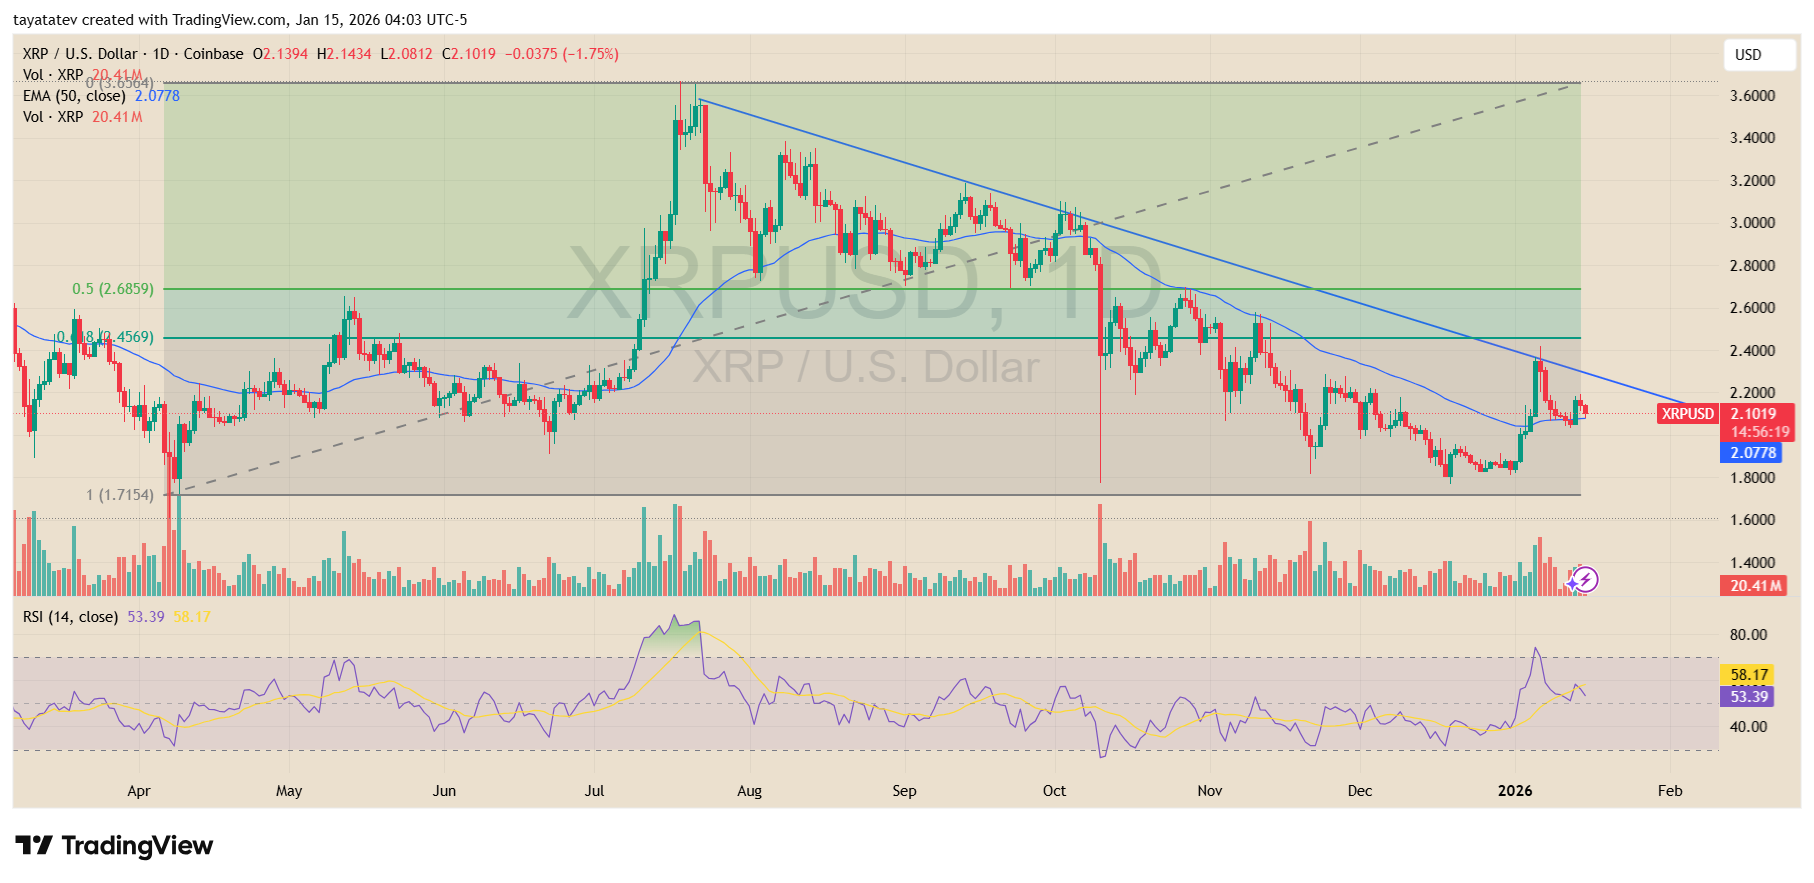
The chart shows a clear sequence of lower highs from the July surge, with a blue descending trendline pressing down across multiple swing tops.
XRP’s latest push higher in early 2026 reached the low $2.40s before fading, and price now sits back near $2.10, which keeps the broader structure tilted lower.
At the same time, XRP is holding just above its 50 day EMA near $2.0778, which acts as the nearest short term pivot.
Holding above that moving average can support consolidation, while a drop back under it would put focus on the recent base area around the high $1.80s and the lower marked level near $1.7154.
For the trend to look like more than a bounce, the chart shows a key reclaim zone overhead.
XRP would need a clean break back into the highlighted “golden zone” area around $2.46 to $2.69, which also lines up with heavy prior trading and the underside of the broader downtrend pressure.
Until price clears that zone and holds it, the move still reads as a recovery attempt inside a larger decline.
Momentum has improved but remains mixed. RSI (14) sits near 53, back above the midpoint after the early January spike cooled, which signals stabilizing strength rather than a full trend flip.
Volume on the session showed around 20.41M, without the kind of sustained expansion that typically confirms a durable breakout on this timeframe.
XRP structure signals late stage setup as price consolidates
Meanwhile, XRP traded near $2.15 on the weekly XRPUSD chart on Bitstamp in mid January, as long term structure pointed to a market approaching another decision point rather than confirming a new trend.
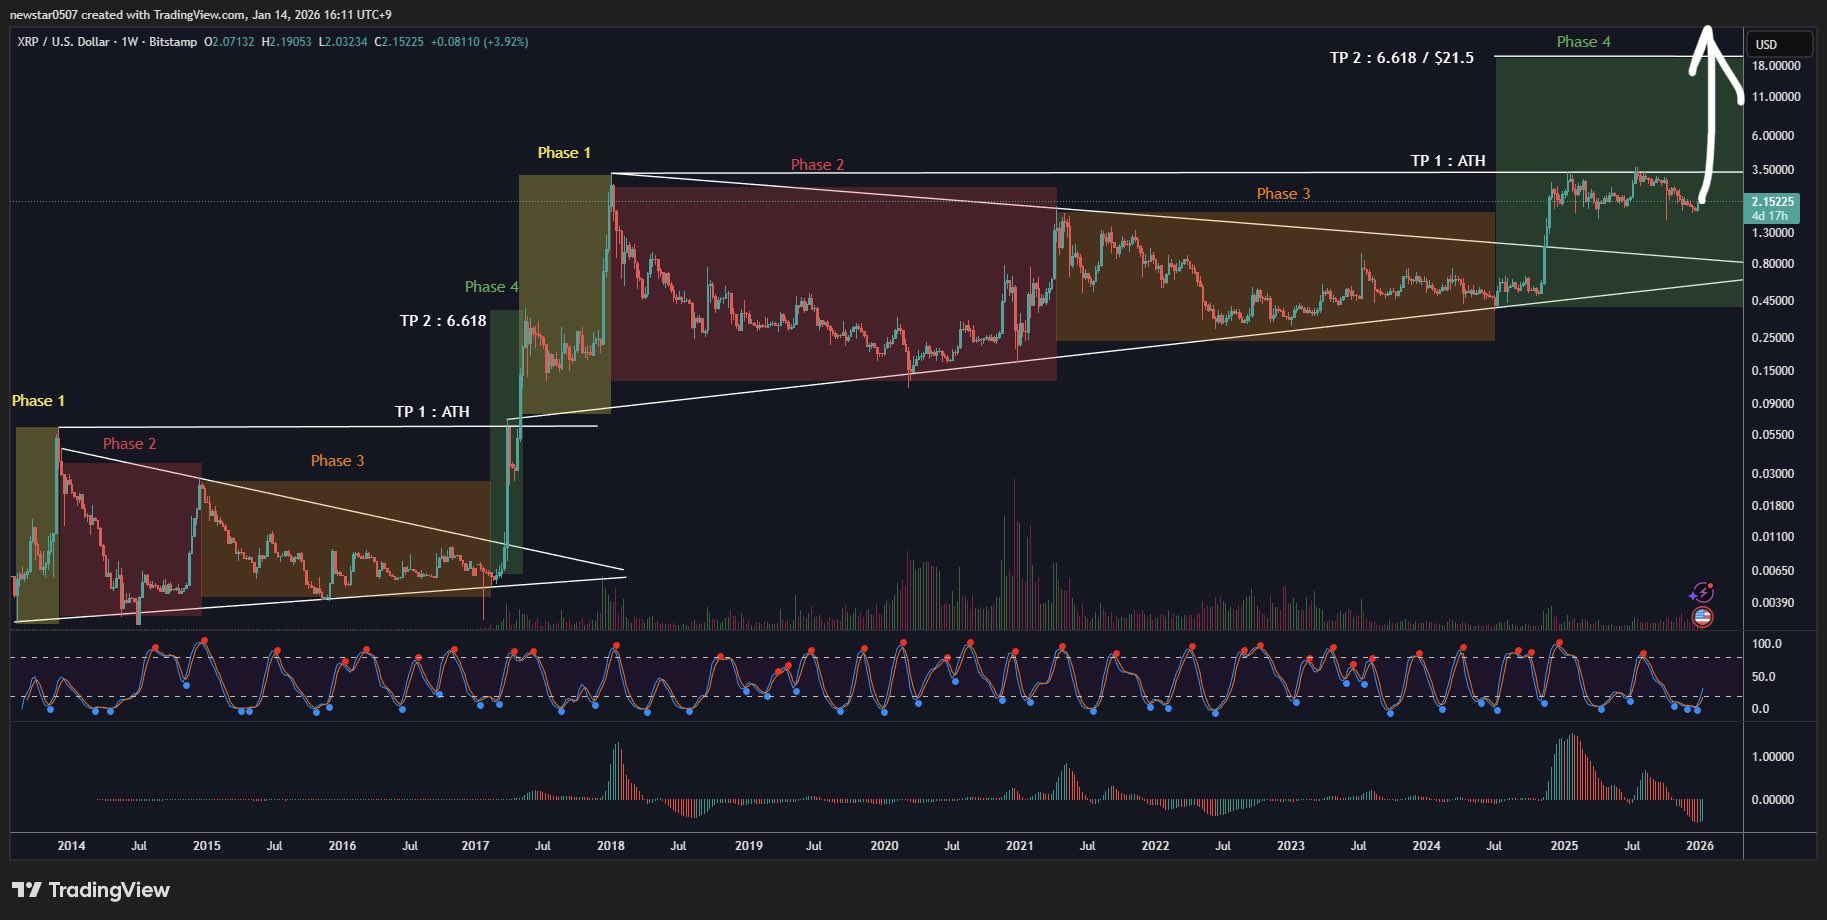
The weekly chart shows XRP moving through a multi phase structure that has repeated across past cycles.
Earlier phases marked sharp advances followed by extended consolidation, while the current phase reflects compression inside a narrowing range after the late 2024 breakout.
Price now trades above prior long term resistance, which has flipped into support, but momentum has slowed compared with the initial expansion.
At the same time, the structure still lacks confirmation of a sustained uptrend continuation.
XRP remains capped below higher extension targets marked near previous all time high levels, while weekly candles show overlapping ranges instead of strong directional follow through.
This behavior often appears when markets pause after a large move, allowing volatility to contract before the next expansion.
Momentum indicators support the view of consolidation rather than exhaustion. Oscillators on the chart cycle through neutral zones instead of staying pinned at extremes, which suggests balance between buyers and sellers.
Volume also shows bursts during breakouts followed by quieter periods, reinforcing the idea that XRP is in a holding phase rather than an impulsive leg.
As a result, the broader setup points to proximity, not confirmation. XRP has moved into a late stage zone where direction matters, yet price still needs a decisive break above the current range to validate continuation.
Until that happens, the structure favors patience, with the chart signaling preparation rather than completion of the next major move.
Disclosure:This article does not contain investment advice or recommendations. Every investment and trading move involves risk, and readers should conduct their own research when making a decision.
Kriptoworld.com accepts no liability for any errors in the articles or for any financial loss resulting from incorrect information.

Tatevik Avetisyan is an editor at Kriptoworld who covers emerging crypto trends, blockchain innovation, and altcoin developments. She is passionate about breaking down complex stories for a global audience and making digital finance more accessible.
📅 Published: January 15, 2026 • 🕓 Last updated: January 15, 2026
