


Ethereum traded near $3,312 on the daily ETHUSD chart from Bitstamp on Jan. 16, after pushing higher from late December lows and holding above several nearby support lines.
Price stayed above the 50 day EMA near $3,153, while RSI rose to about 62.6, which kept momentum tilted upward on this setup.
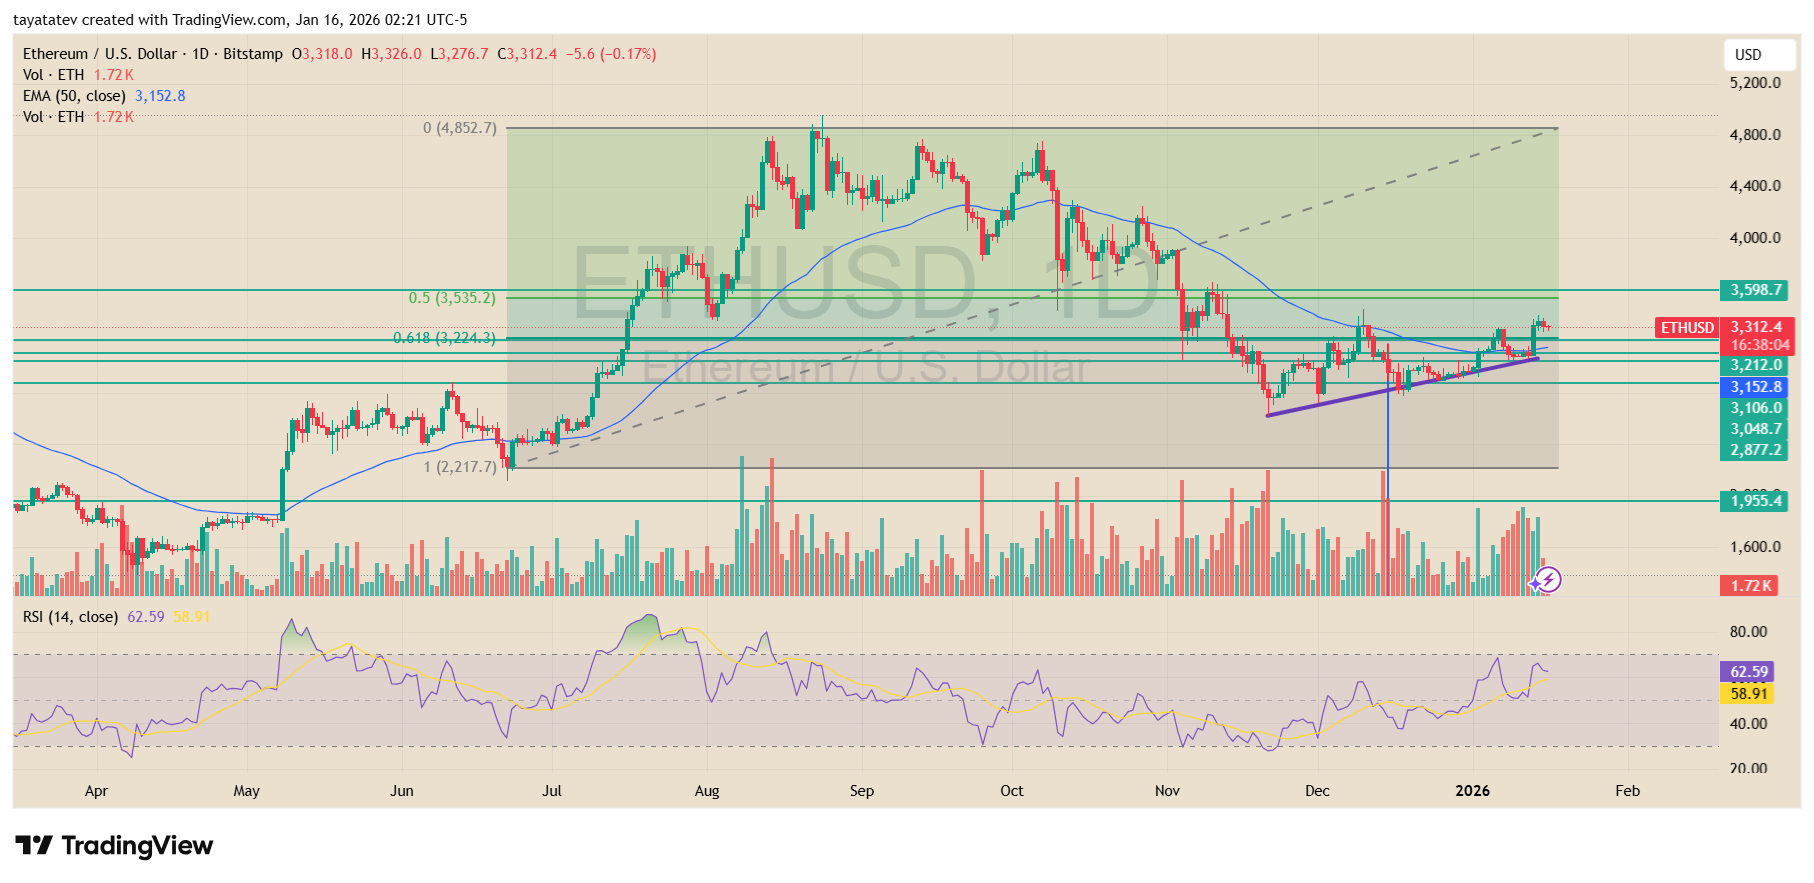
The chart shows ETH climbing in an uptrend since the early January turn, with price building higher lows along a rising support line that starts from the November base.
That climb also reclaimed the mid range area around $3,106 to $3,152, then held it as support.
In addition, ETH now sits above the 0.618 Fibonacci level near $3,224, which marks a key reclaim inside the prior swing structure.
Near term, the next major ceiling on this chart sits at $3,598, marked by the higher green level above current price.
ETH has already moved back into the band of prior congestion from late 2025, so a clean daily close above the nearby resistance cluster around $3,312 to $3,535 would keep the path open toward $3,598.
The 0.5 Fibonacci level near $3,535 sits just below that target, so price may pause there before attempting the higher level.
If ETH clears $3,598 and holds above it, the next upside area on this structure lines up near $3,906, which matches a prior supply zone from the earlier breakdown and the lower edge of the broader range that dominated the second half of 2025.
A push into that area would also place ETH back into the middle of the larger distribution range shown on the chart, where sellers previously stepped in during failed rallies.
On the downside, the chart keeps several clear levels that frame the uptrend risk. First, a pullback that loses $3,224 would weaken the reclaimed Fibonacci support.
After that, the 50 day EMA near $3,153 becomes the next key line, since price has recently used it as a pivot.
A deeper slide would bring $3,106 and $3,049 back into view, with the larger support area closer to $2,877 acting as the next major floor from the late 2025 base.
Stay ahead in the crypto world – follow us on X for the latest updates, insights, and trends!🚀
ETHBTC structure shows re accumulation after long decline, upside expansion back in focus
Ethereum traded near 0.0343 BTC on the weekly ETHBTC chart from Kraken on Jan. 12, as the pair stabilized after a long multi year decline against Bitcoin.
Price held above the lower boundary of a falling channel and started to curl higher, which shifted the structure away from pure downside continuation.
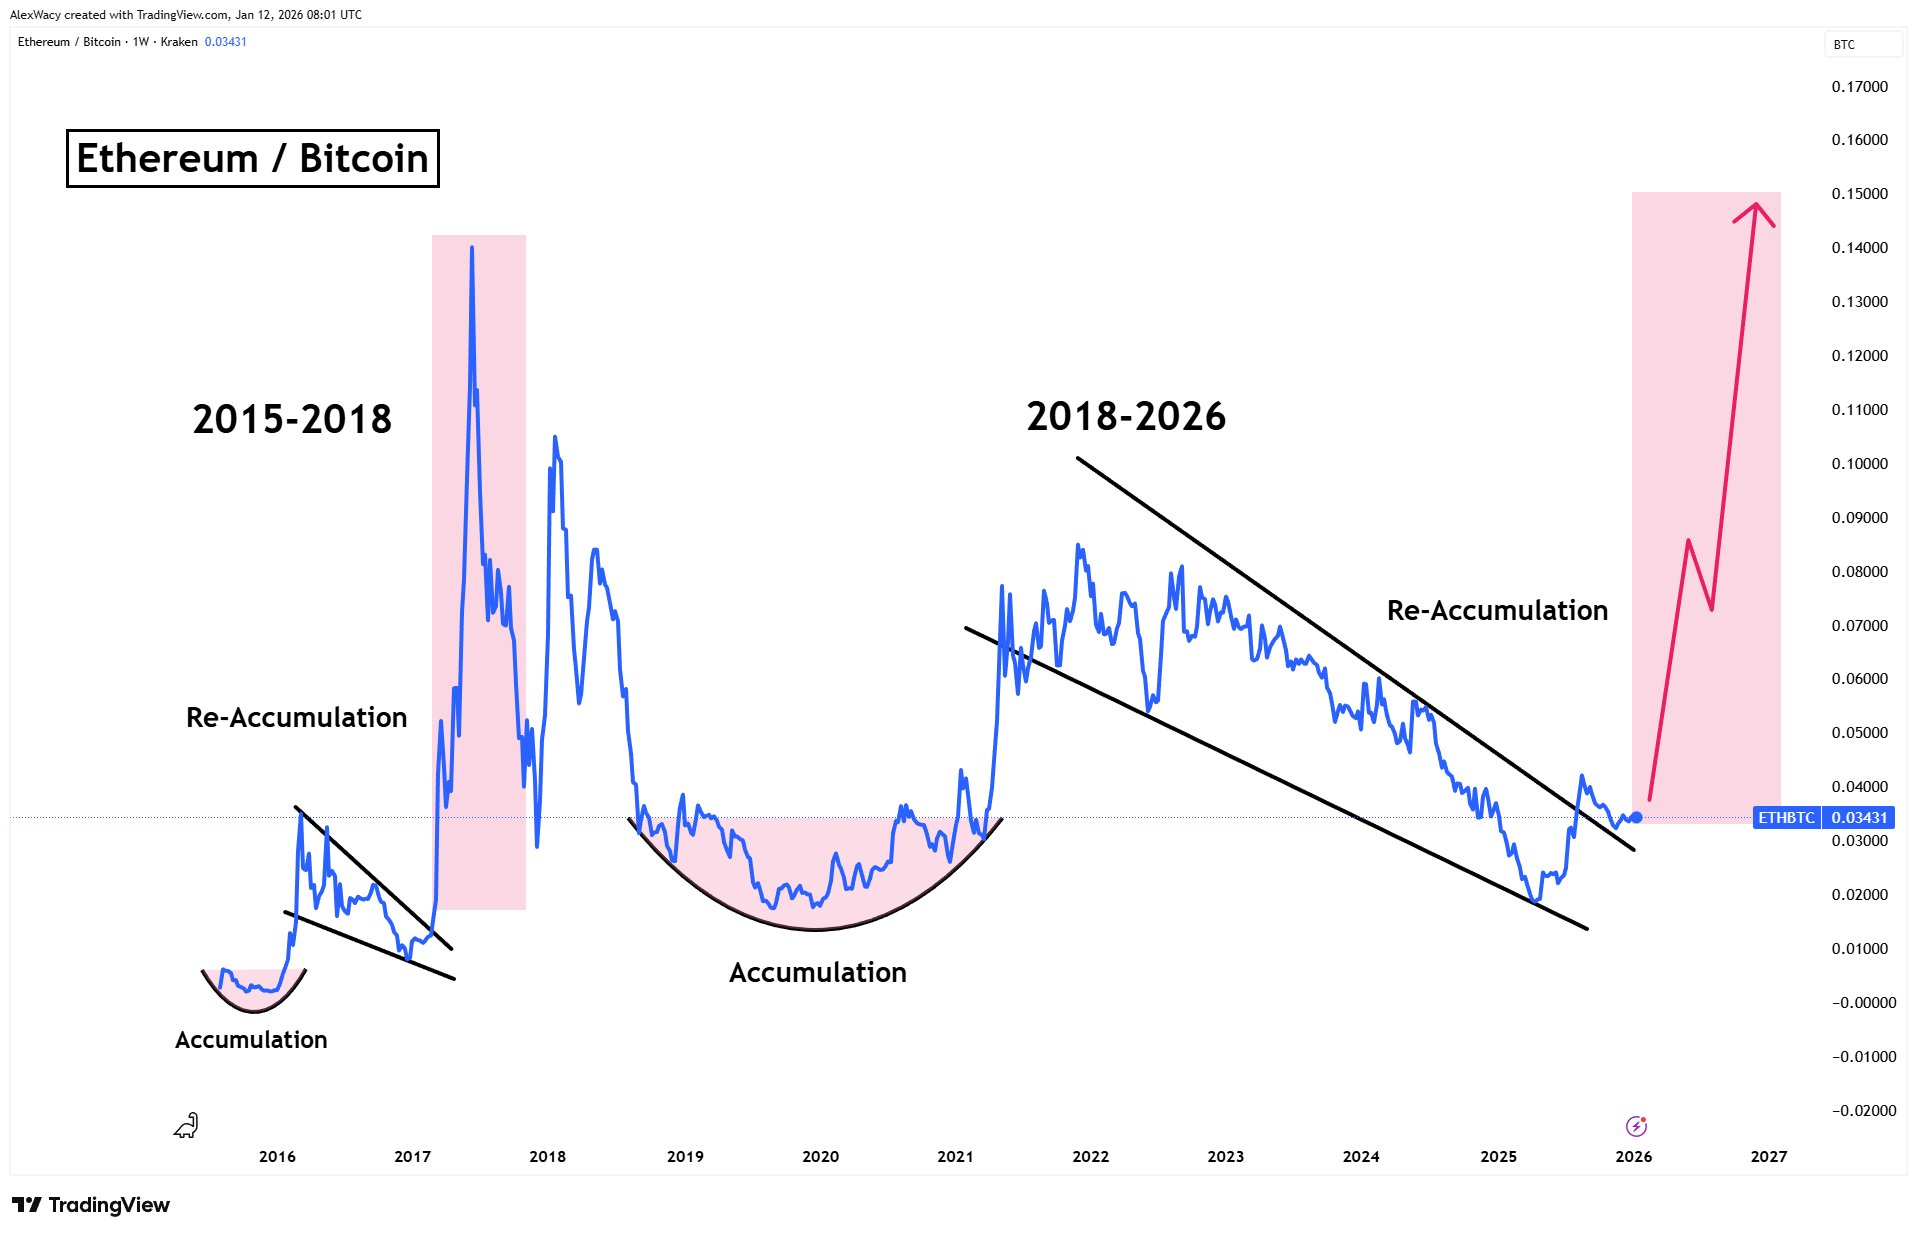
The chart outlines a full market cycle that stretches back to 2015. After the initial accumulation phase, ETHBTC surged sharply into the 2017–2018 peak, then entered a prolonged distribution and decline.
From 2018 through 2020, the pair carved out a rounded base, which marked a broad accumulation zone before the 2021 breakout.
That rally faded into another extended downtrend that dominated the 2022–2025 period.
During the recent phase, ETHBTC traded inside a well defined descending channel, printing lower highs and lower lows. However, that structure began to weaken as price approached the channel floor near the 0.02–0.025 BTC area. Instead of accelerating lower, ETHBTC based and rebounded, which broke the immediate bearish rhythm. The current move back toward 0.034 BTC places price at the edge of a prior consolidation band.
The chart labels this zone as re accumulation, which reflects sideways compression after a long decline rather than distribution at highs.
Similar behavior appeared before the 2017 and 2021 upside expansions, where ETHBTC spent extended time building a base before sharp vertical moves.
In this case, the pair has already reclaimed a minor horizontal level, which signals that sellers are losing control compared with earlier years.
If ETHBTC continues to hold above the former channel and maintains weekly closes near or above 0.034 BTC, the next technical objective shifts higher into the mid range of the prior structure.
That opens room for a broader expansion phase toward the 0.06–0.08 BTC area over time, which aligns with earlier congestion zones.
A stronger breakout could later target the upper historical band highlighted on the chart, where previous cycle peaks formed.
On the downside, failure to hold the reclaimed level would place focus back on the former channel support. A sustained move below the recent base would weaken the re accumulation thesis and delay any larger relative strength move versus Bitcoin.
For now, the structure favors stabilization and rebuilding rather than immediate continuation of the long term downtrend.
Disclosure:This article does not contain investment advice or recommendations. Every investment and trading move involves risk, and readers should conduct their own research when making a decision.
Kriptoworld.com accepts no liability for any errors in the articles or for any financial loss resulting from incorrect information.

Tatevik Avetisyan is an editor at Kriptoworld who covers emerging crypto trends, blockchain innovation, and altcoin developments. She is passionate about breaking down complex stories for a global audience and making digital finance more accessible.
📅 Published: January 16, 2026 • 🕓 Last updated: January 16, 2026
