


XRP’s current market structure “closely resembles” February 2022, according to on chain analytics firm Glassnode, which pointed to a fresh split between short term buyers and mid term holders on its realized price by age chart.
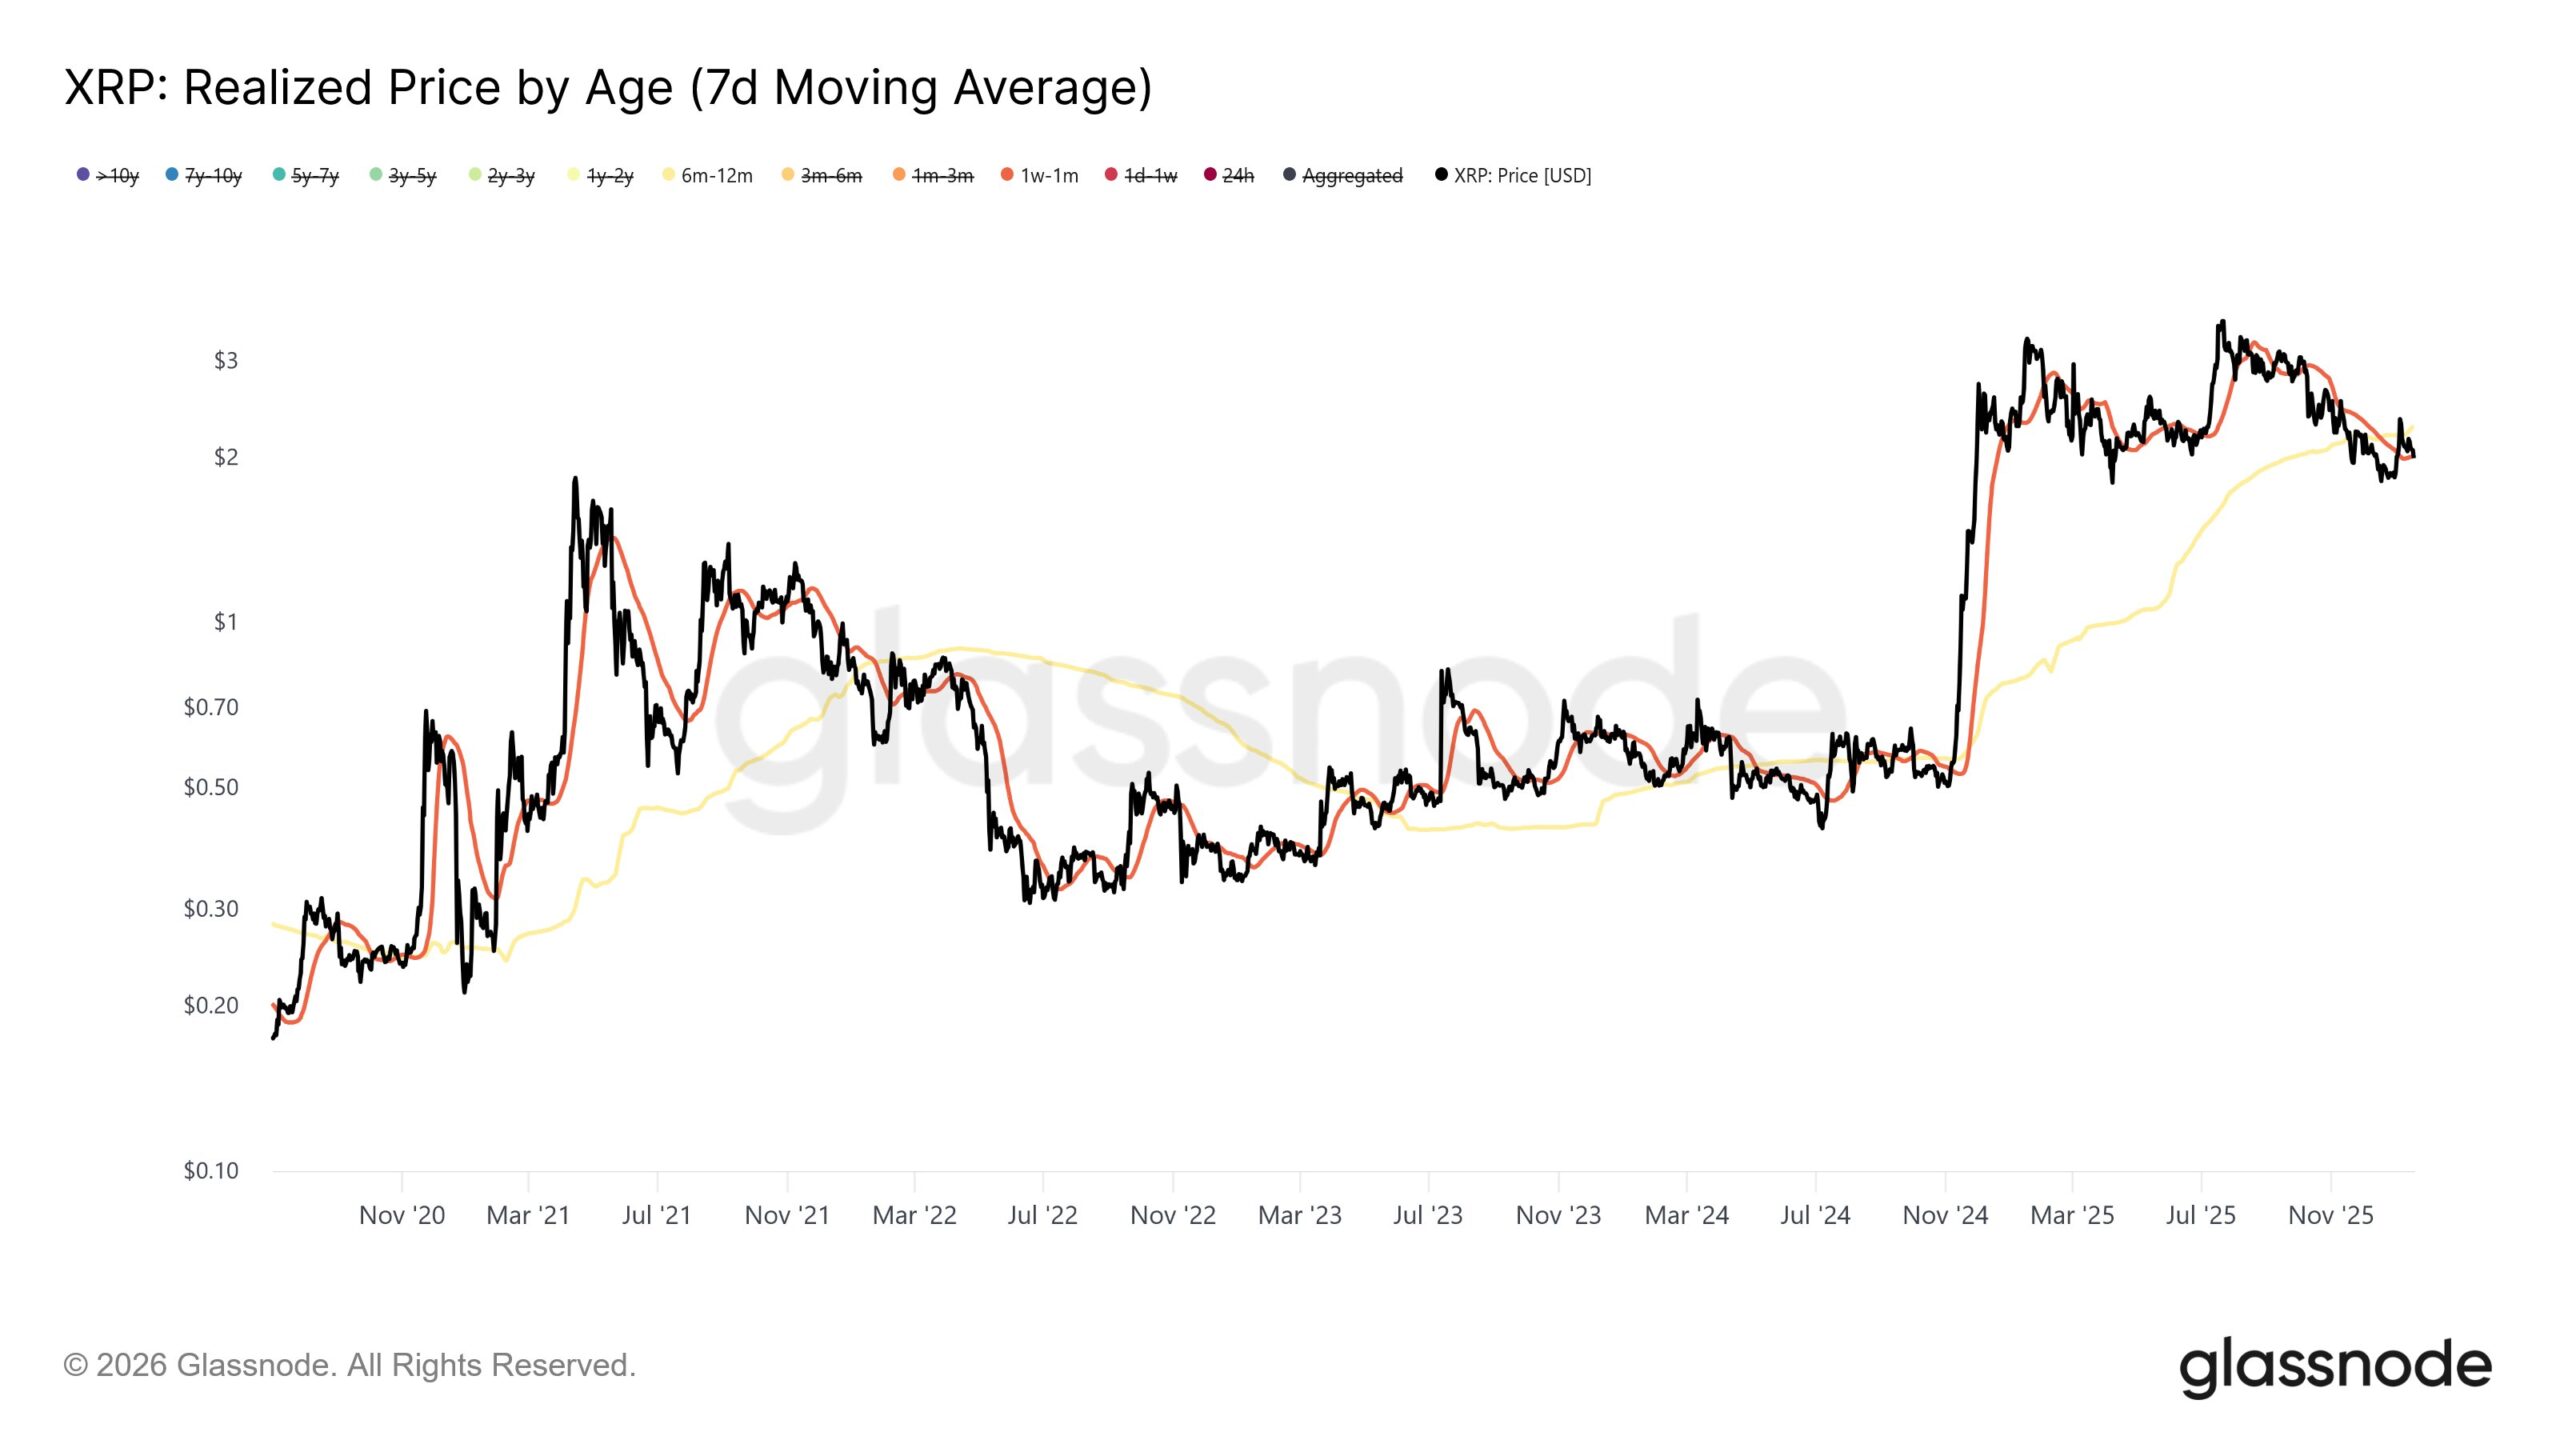
In its post on X, Glassnode said investors active in the 1 week to 1 month window are accumulating XRP at prices below the cost basis of the 6 month to 12 month cohort.
That setup means newer buyers, on average, hold coins bought cheaper than a large group that entered earlier and now sits at higher realized prices.
Glassnode said the gap increases psychological pressure on “top buyers” as long as the structure persists.
On the chart, the 1W to 1M realized price line sits under the 6M to 12M line while XRP’s spot price trades between multiple cohort bands, a pattern the firm tied to the same kind of positioning seen in early 2022.
XRP consolidates inside narrowing range with breakout level near $2.23
Meanwhile, XRP price action on the 4 hour chart suggests a falling wedge structure, according to market analyst Ali Charts, as the token trades near the lower boundary of a narrowing range.
The pattern forms after a sustained decline from the recent high above $2.40, with lower highs and lower lows compressing toward a convergence point.
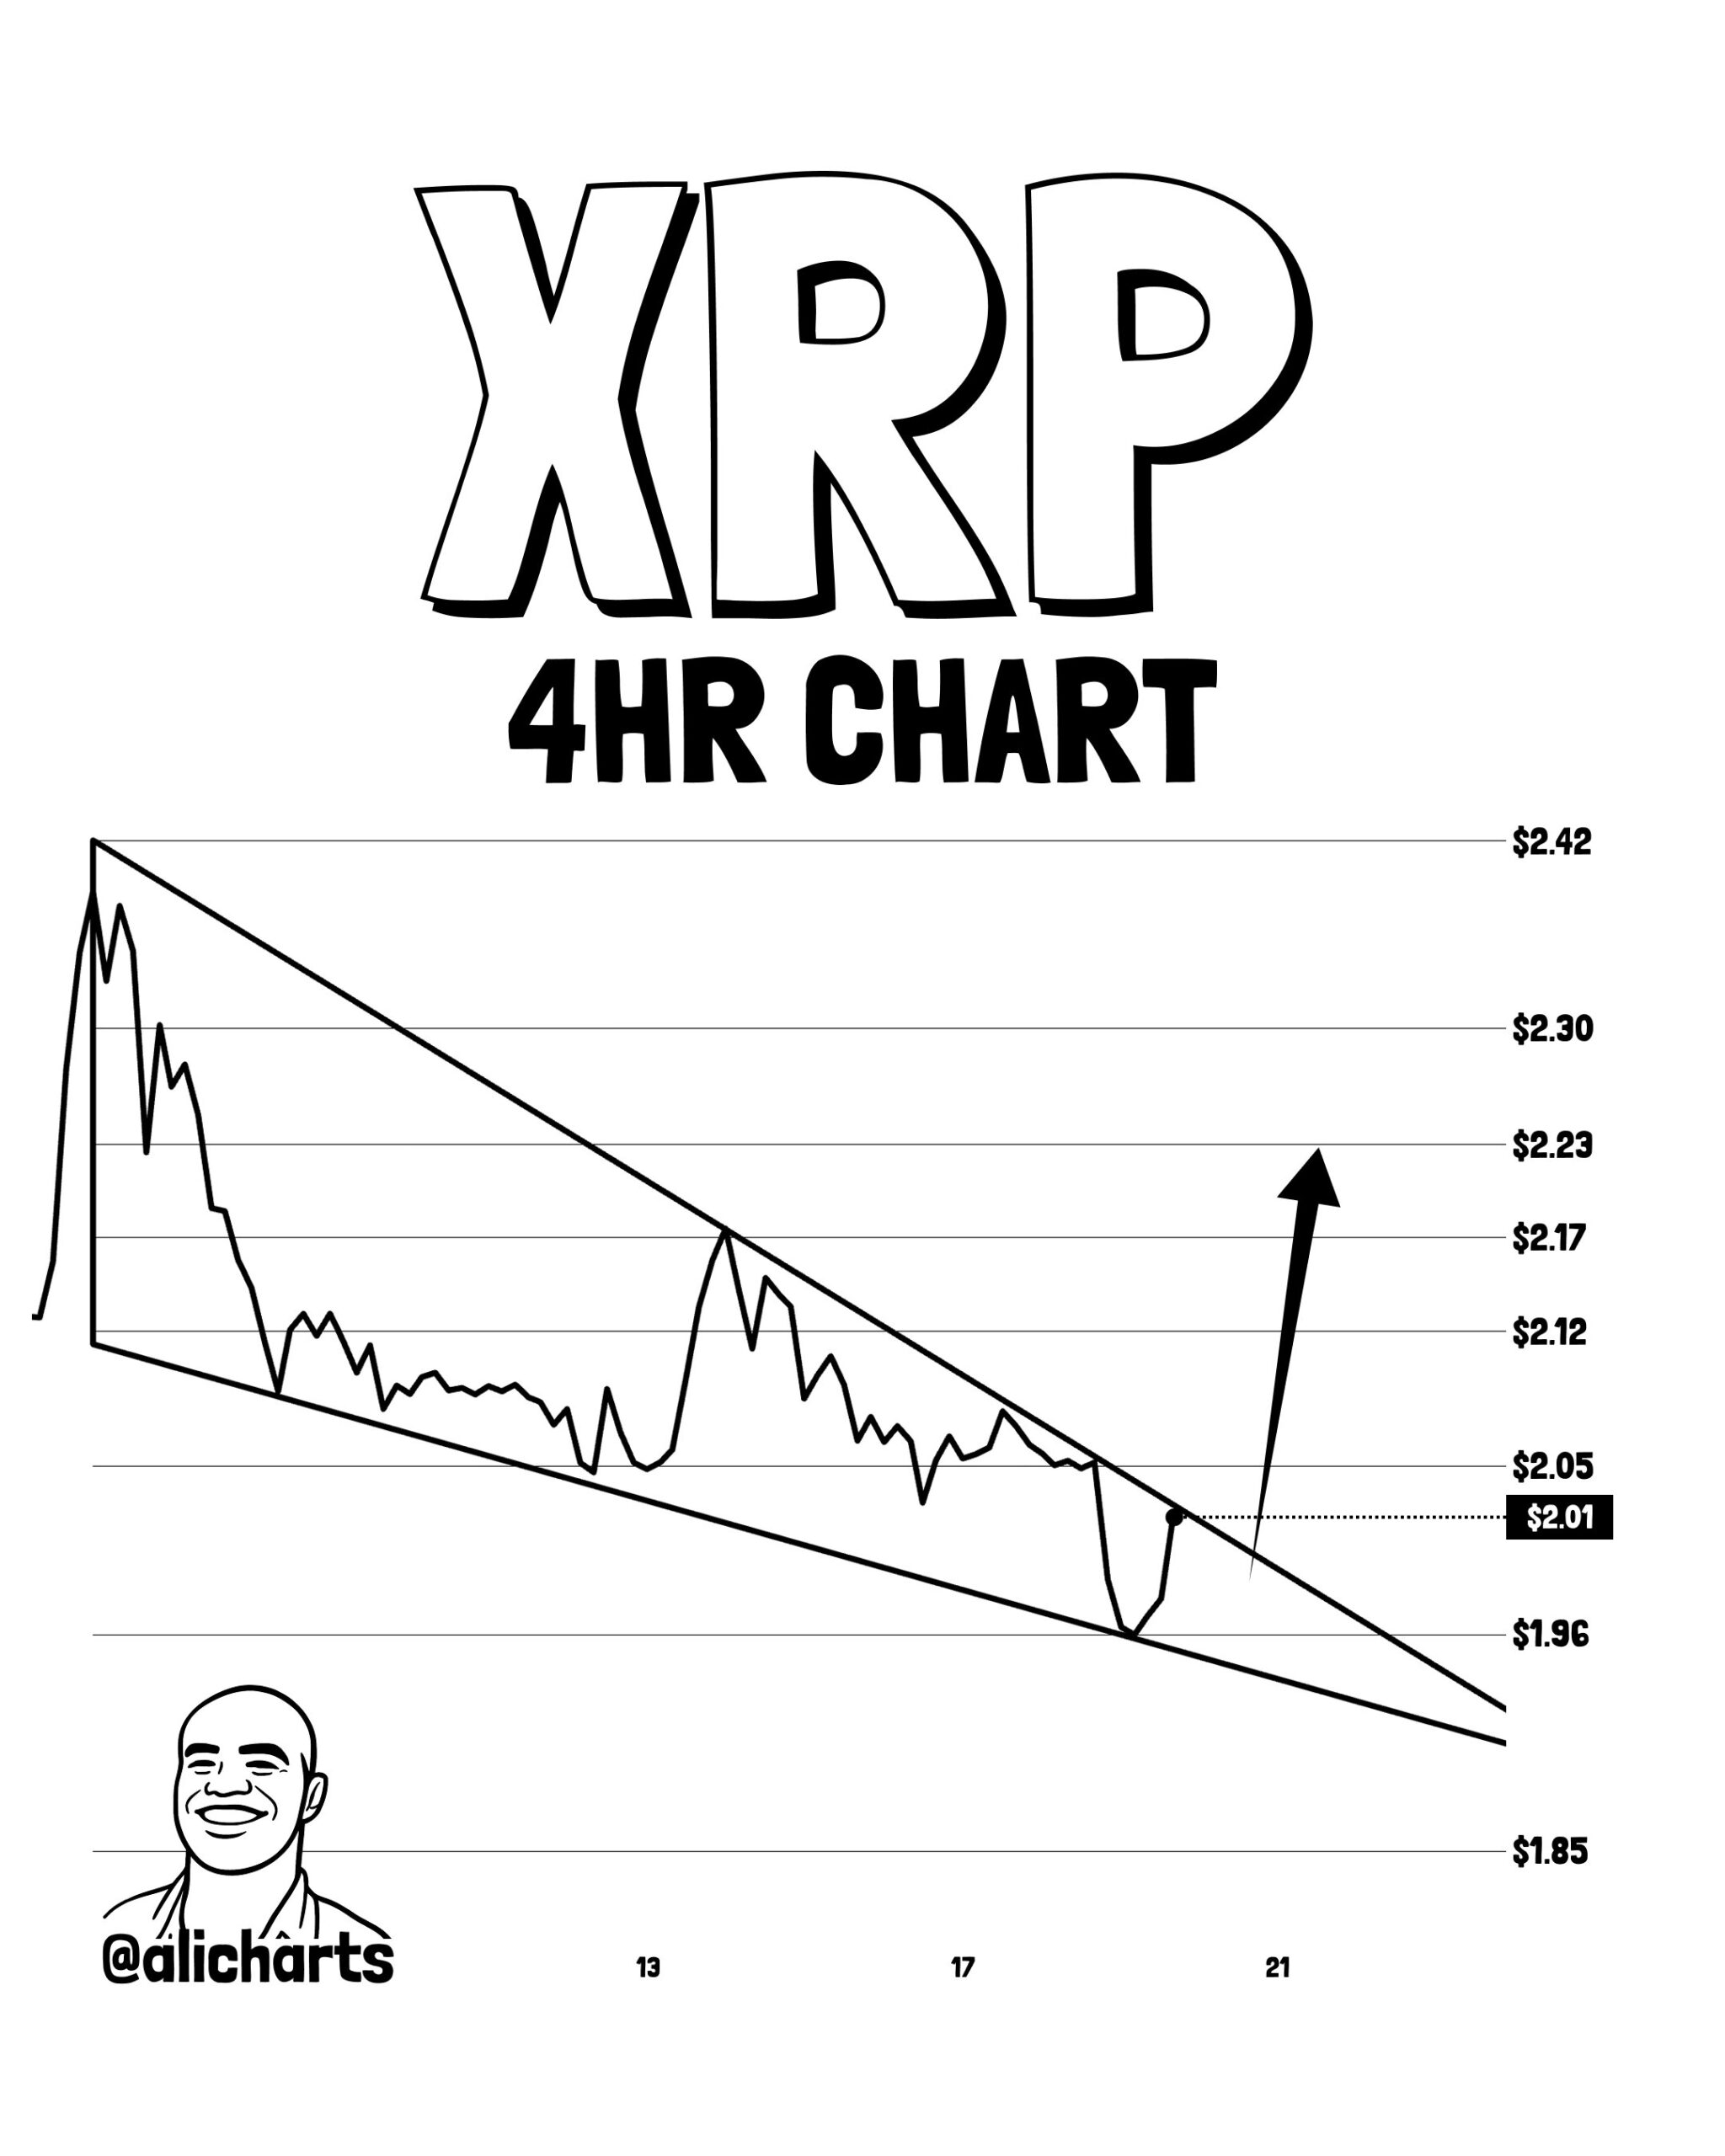
The chart shows XRP rebounding from the wedge’s lower trendline near the $1.96 to $1.98 area before stabilizing around $2.01.
That move keeps price inside the structure rather than breaking down, a detail often watched during late stage consolidation.
Horizontal levels marked on the chart place nearby resistance around $2.05 and $2.12, while the upper wedge boundary aligns closer to the $2.17 zone.
Ali Charts noted that a confirmed break above the descending trendline could open a move toward $2.23, which sits near a prior resistance level.
Until such a break occurs, price remains technically constrained within the wedge, with short term direction tied to whether buyers can push XRP above the pattern’s upper boundary.
Disclosure:This article does not contain investment advice or recommendations. Every investment and trading move involves risk, and readers should conduct their own research when making a decision.
Kriptoworld.com accepts no liability for any errors in the articles or for any financial loss resulting from incorrect information.

Tatevik Avetisyan is an editor at Kriptoworld who covers emerging crypto trends, blockchain innovation, and altcoin developments. She is passionate about breaking down complex stories for a global audience and making digital finance more accessible.
📅 Published: January 20, 2026 • 🕓 Last updated: January 20, 2026
