


Bitcoin may still face more downside before any durable low forms, according to a TradingView chart shared by X user Aralez.
The post compared the current Bitcoin pullback to the 2022 bear market structure and argued most traders miss the similarity.
Stay ahead in the crypto world – follow us on X for the latest updates, insights, and trends!🚀
Aralez also said the bottom “isn’t in yet” and urged followers not to rush into accumulation.
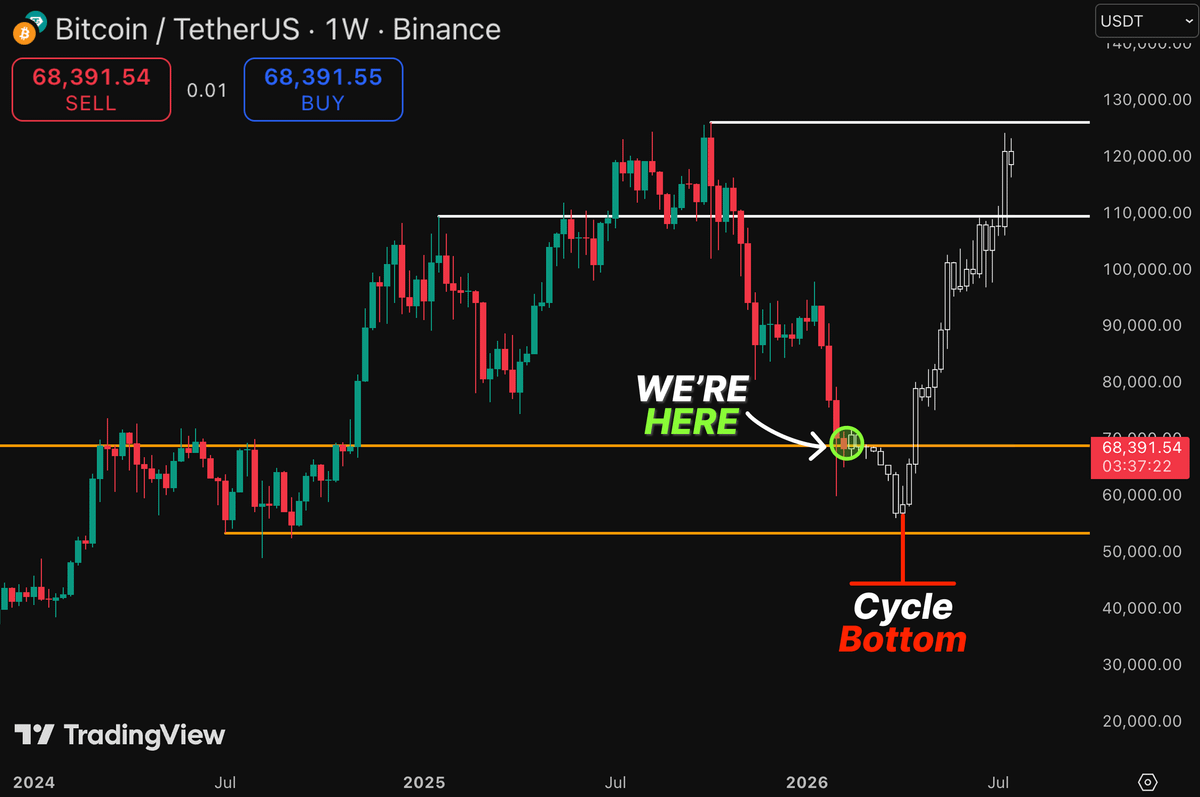
Chart marks a support zone as “We’re Here”
The weekly BTCUSDT chart highlighted a mid range level near $68,000 with an orange horizontal line. A green circle and “WE’RE HERE” label pointed to that zone after a sharp drop and rebound attempt.
The same graphic also drew a lower orange line near the mid $50,000s, framing a wider support band below current price. The candles showed a heavy selloff into early 2026, followed by a bounce that still sits under prior weekly highs.
Meanwhile, the chart added a “Cycle Bottom” label beneath the mid $50,000 area, using a red vertical marker to suggest where a final low could land if the pattern continues.
2022 comparison suggests rebound after a deeper low
Aralez’s overlay projected a drop toward the lower support line before a recovery path. The forward sketch then climbed back through the $70,000 area and pushed toward higher resistance zones.
Two white horizontal bands near $110,000 and around $125,000 to $130,000 marked prior ceiling areas on the chart. The projection aimed into those levels after the proposed bottoming phase.
In the caption, Aralez said the market repeats a 2022 style pattern and claimed “99% miss it,” while adding that they would call the bottom publicly later.
Bitcoin rebounds from February low but still needs a key level to confirm reversal
Bitcoin rebounded after the Feb. 16, 2026 selloff on the daily BTCUSD Bitstamp chart created on TradingView.
Price printed near $68,361 after a sharp drop below prior support, then staged a short bounce inside a descending channel.
As a result, the move marks the first active upside attempt since the latest breakdown.
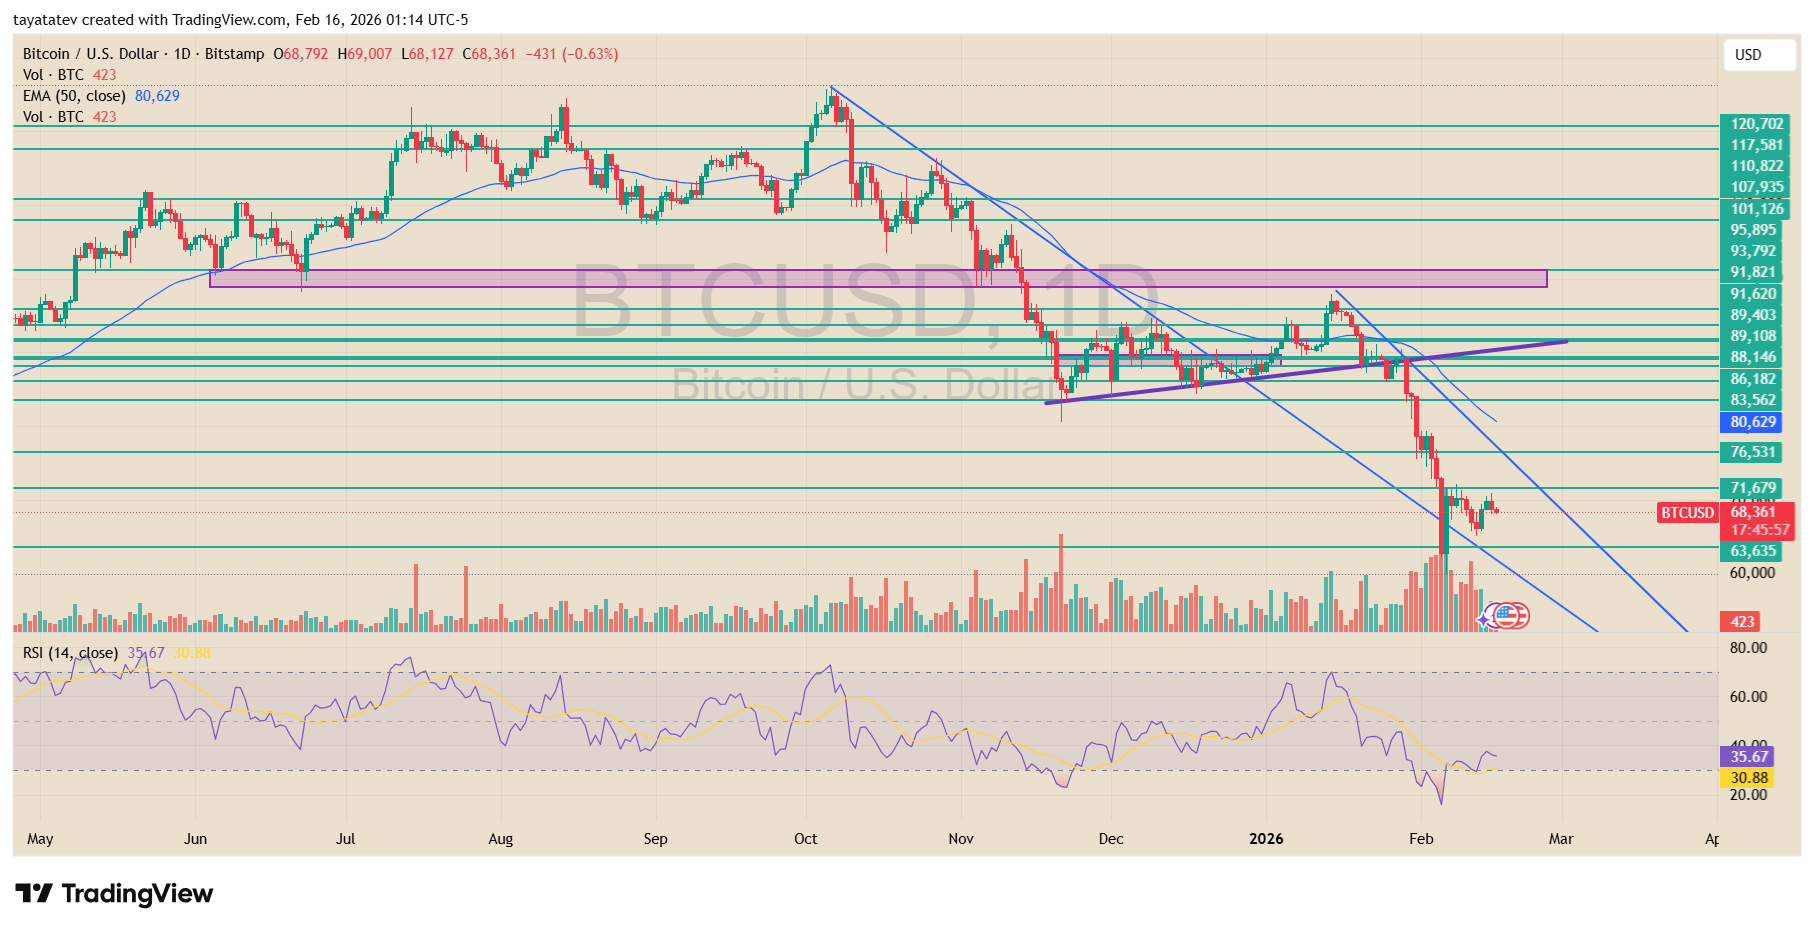
However, the broader structure remains pressured. The downtrend lines continue to slope lower, and price still trades below the 50 day EMA near $80,629.
Therefore, the rebound counts as an active recovery phase, not a confirmed trend change.
To confirm a reversal, Bitcoin needs to reclaim and hold above the nearby green resistance band.
That zone sits above current price and aligns with prior support turned resistance. Until price reaches and holds that green line, the trend stays corrective, even if short term bounces continue.
Disclosure:This article does not contain investment advice or recommendations. Every investment and trading move involves risk, and readers should conduct their own research when making a decision.
Kriptoworld.com accepts no liability for any errors in the articles or for any financial loss resulting from incorrect information.

Tatevik Avetisyan is an editor at Kriptoworld who covers emerging crypto trends, blockchain innovation, and altcoin developments. She is passionate about breaking down complex stories for a global audience and making digital finance more accessible.
📅 Published: February 16, 2026 • 🕓 Last updated: February 16, 2026
