


Bitcoin remains in a clear downtrend on the daily chart, as price continues to trade below falling trendline resistance and under the 50-day exponential moving average.
Since late October, lower highs and lower lows have defined market structure. Each rebound has stalled earlier than the last, which shows sellers still control momentum.
Stay ahead in the crypto world – follow us on X for the latest updates, insights, and trends!🚀
Meanwhile, price action remains compressed inside a descending channel, reinforcing the broader bearish trend.
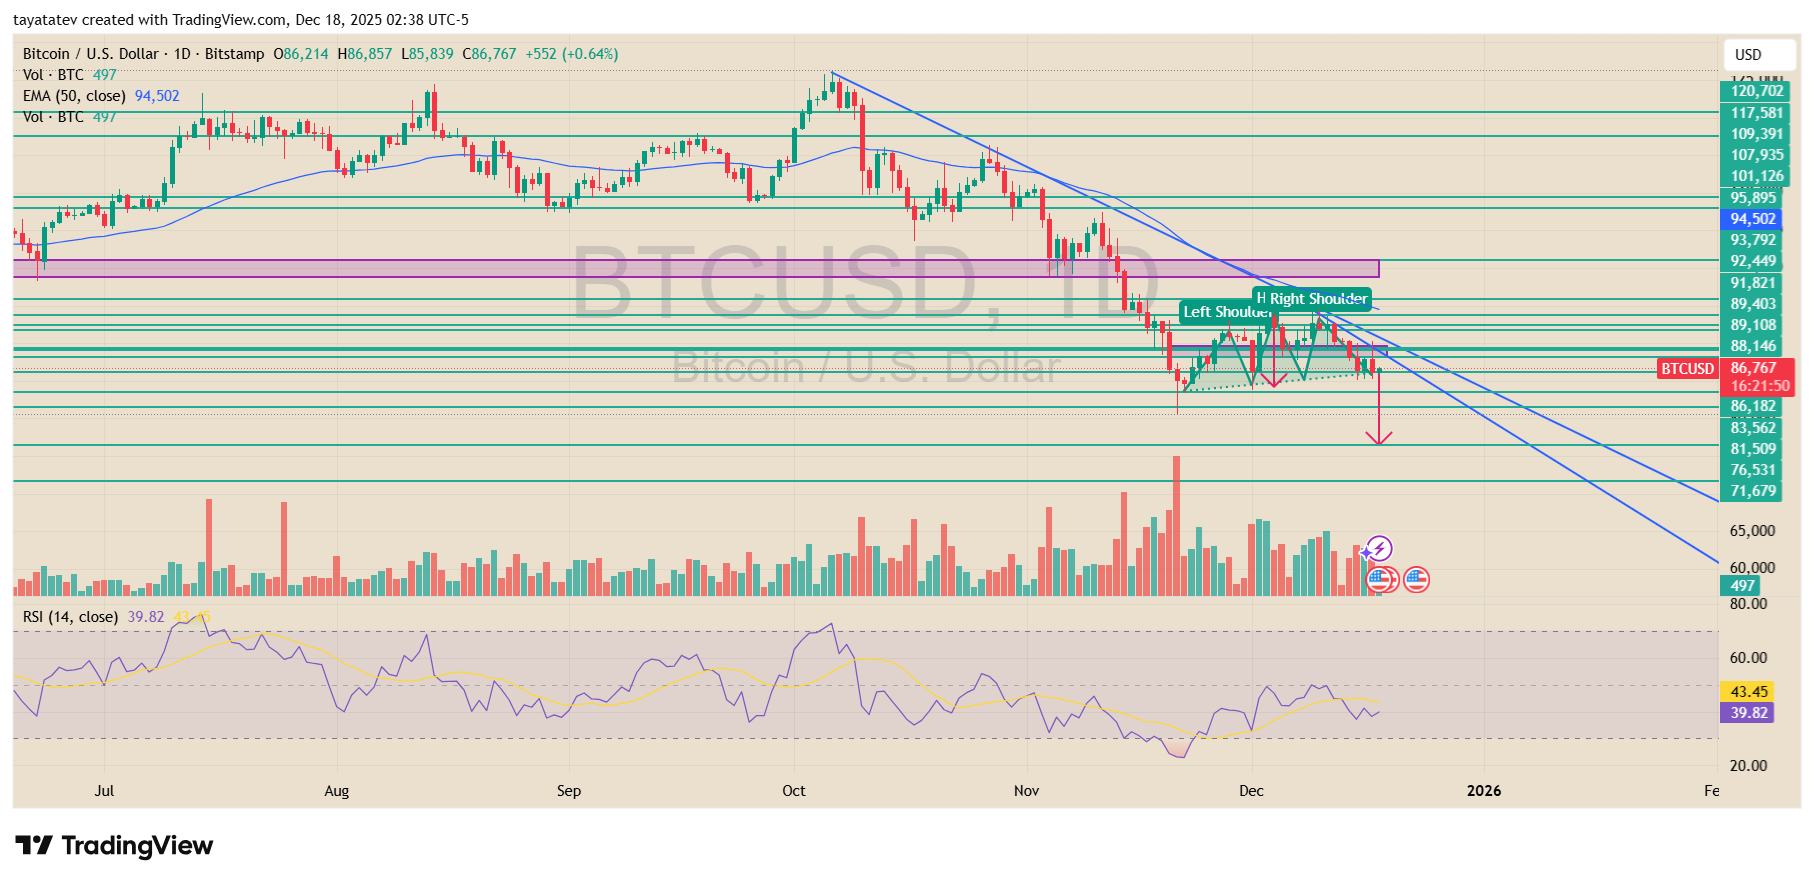
Within that downtrend, Bitcoin has now formed a visible head and shoulders pattern.
The chart shows a left shoulder near the late November rebound, a deeper pullback that formed the head in early December, and a weaker right shoulder that failed below prior resistance.
This structure developed under the descending trendline, which adds technical weight to the pattern. At the same time, horizontal support near the neckline has been tested multiple times, weakening that level with each bounce.
If the head and shoulders pattern confirms with a decisive daily close below the neckline, technical projections point to further downside.
Based on the height from the head to the neckline, the measured move suggests a potential drop of about 11% from current levels.
With Bitcoin trading near $86,700, that projection targets the $77,000 area. This level also aligns with a cluster of prior support on the chart, which could act as the next downside zone if selling accelerates.
Momentum indicators reflect this fragile setup. The relative strength index sits below the neutral 50 level, showing that bullish momentum remains limited.
Although RSI has stabilized in recent sessions, it has not reclaimed levels associated with trend reversals.
Volume patterns also show stronger activity during selloffs than during rebounds, which supports the prevailing bearish bias.
For now, Bitcoin remains technically vulnerable. The downtrend is intact, the head and shoulders pattern is active, and price has yet to reclaim key resistance levels.
Unless buyers regain control above the neckline and trendline resistance, the chart continues to favor downside risk in the near term.
Bitcoin chart maps repeat cycle windows as price sits in a “reset” zone
Meanwhile, a long term Bitcoin chart shared on X by CryptoXLARG frames price action as repeating blocks of similar length.
The overlay highlights two recurring time windows on TradingView: a larger advance phase marked “152 bars, 1,064d” and a smaller decline phase marked “52 bars, 364d.”
The graphic places these blocks over the 2019 to 2021 run and the 2022 downturn, then applies the same timing template to the 2023 to 2025 rally and the latest pullback.
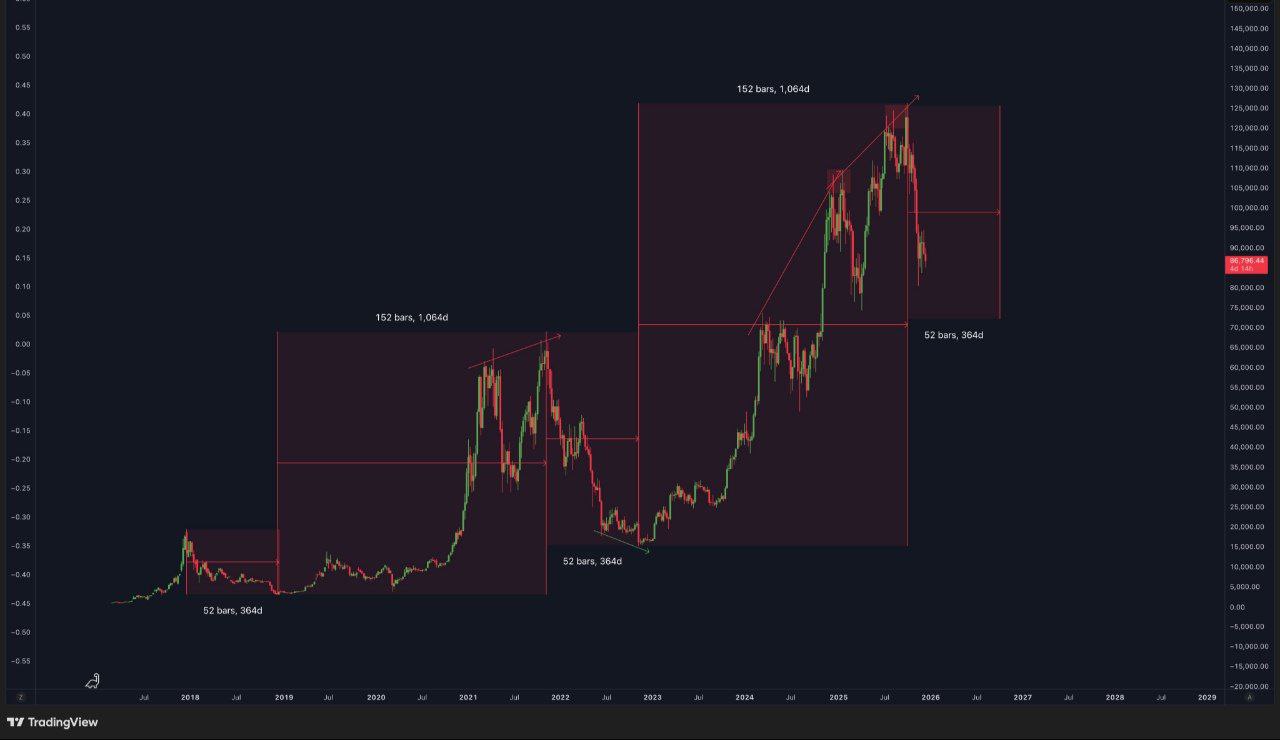
The chart also shows Bitcoin falling sharply from a 2025 peak near the top of the highlighted range, then dropping into the newer 52 bar box on the right side.
That box begins after the peak and extends roughly one year, matching the “reset” language in the post.
At the time of the screenshot, the price marker sits around the mid $80,000s, which places Bitcoin well below the prior high and inside the projected reset window.
Even so, the image does not prove the cycle will repeat, because it uses past segments to outline a similar path for the current market.
What it does show is how the author measures previous expansions and drawdowns by duration, then compares today’s decline to the earlier 2022 reset.
In that setup, the current move fits the same timing bucket, while the next directional break would depend on whether price later exits the box to the upside or continues to trend lower within it.
Disclosure:This article does not contain investment advice or recommendations. Every investment and trading move involves risk, and readers should conduct their own research when making a decision.
Kriptoworld.com accepts no liability for any errors in the articles or for any financial loss resulting from incorrect information.

Tatevik Avetisyan is an editor at Kriptoworld who covers emerging crypto trends, blockchain innovation, and altcoin developments. She is passionate about breaking down complex stories for a global audience and making digital finance more accessible.
📅 Published: December 18, 2025 • 🕓 Last updated: December 18, 2025
