


Bitcoin trades near 92,000 dollars while it stays below the key bearish trendline that started from the autumn peak.
The chart shows the price pressing into the 93,000 to 94,000 dollar resistance zone, but it has not cleared it. Because of that, the broader structure still leans bearish.
Stay ahead in the crypto world – follow us on X for the latest updates, insights, and trends!🚀
The market keeps printing lower highs, and each recovery attempt has faded under the same descending line.
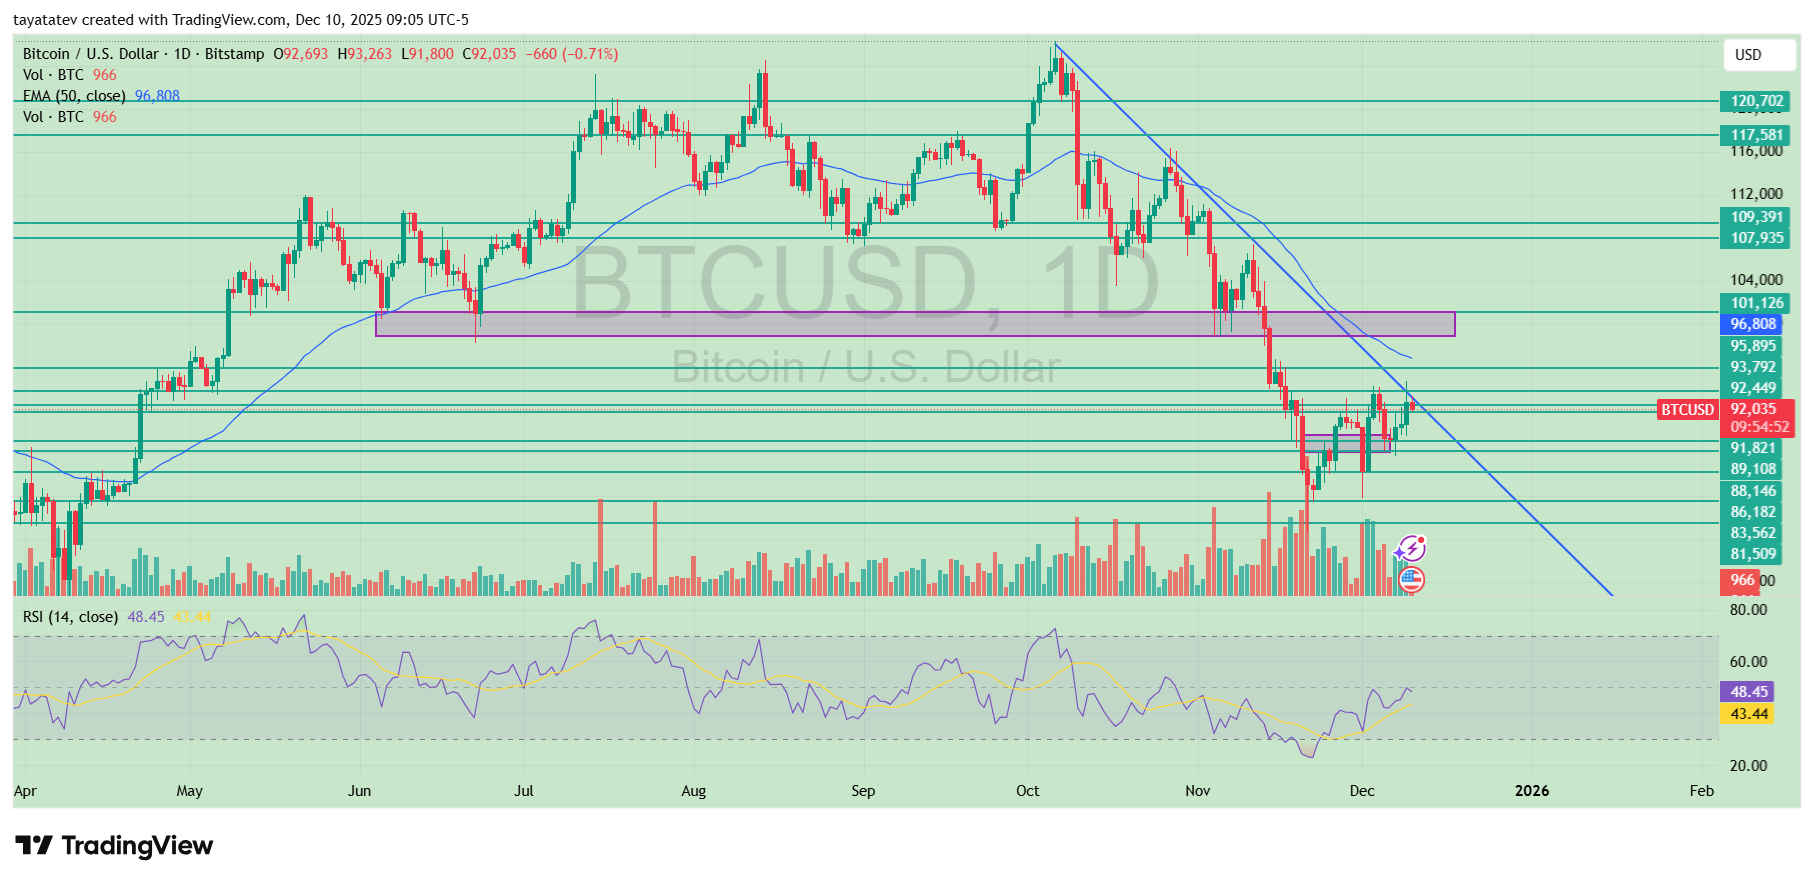
Price must break above 93,000 dollars to confirm any real shift. This level sits just under the bearish trendline, so a clean move through both would signal that momentum is turning. Until that happens, sellers keep the upper hand.
The 50 day EMA at roughly 96,800 dollars adds another layer above, showing that even a first breakout must continue for the chart to flip into a full bullish structure.
Volume remains modest compared with the sharp selloff in November.
That pattern matches a typical bear-market bounce, since rallies in downtrends often lack strong participation. Meanwhile, support holds between 91,000 and 88,000 dollars.
If Bitcoin fails to reclaim 93,000 dollars, price can slip back into this lower range as traders wait for clearer confirmation.
The RSI sits near neutral, which shows no extreme pressure on either side. It climbed from oversold territory, but it has not broken into strong bullish momentum.
In short, Bitcoin stays in a bearish trend as long as it trades under the descending line. Only a decisive break above 93,000 dollars would allow the market to argue for a reversal rather than another temporary bounce.
Bitcoin Weekly Chart: Gann Square View
Bitcoin trades around 92,000 dollars while the weekly candle sits directly on one of the Gann arcs.
The structure shows price caught between two possible outcomes, and the chart has not confirmed either direction yet.
The move from the recent peak still forms a clean downward leg, so the broader picture keeps the bear-flag scenario on the table.
That pattern remains valid as long as lower highs continue and the market fails to break the arc with strength.
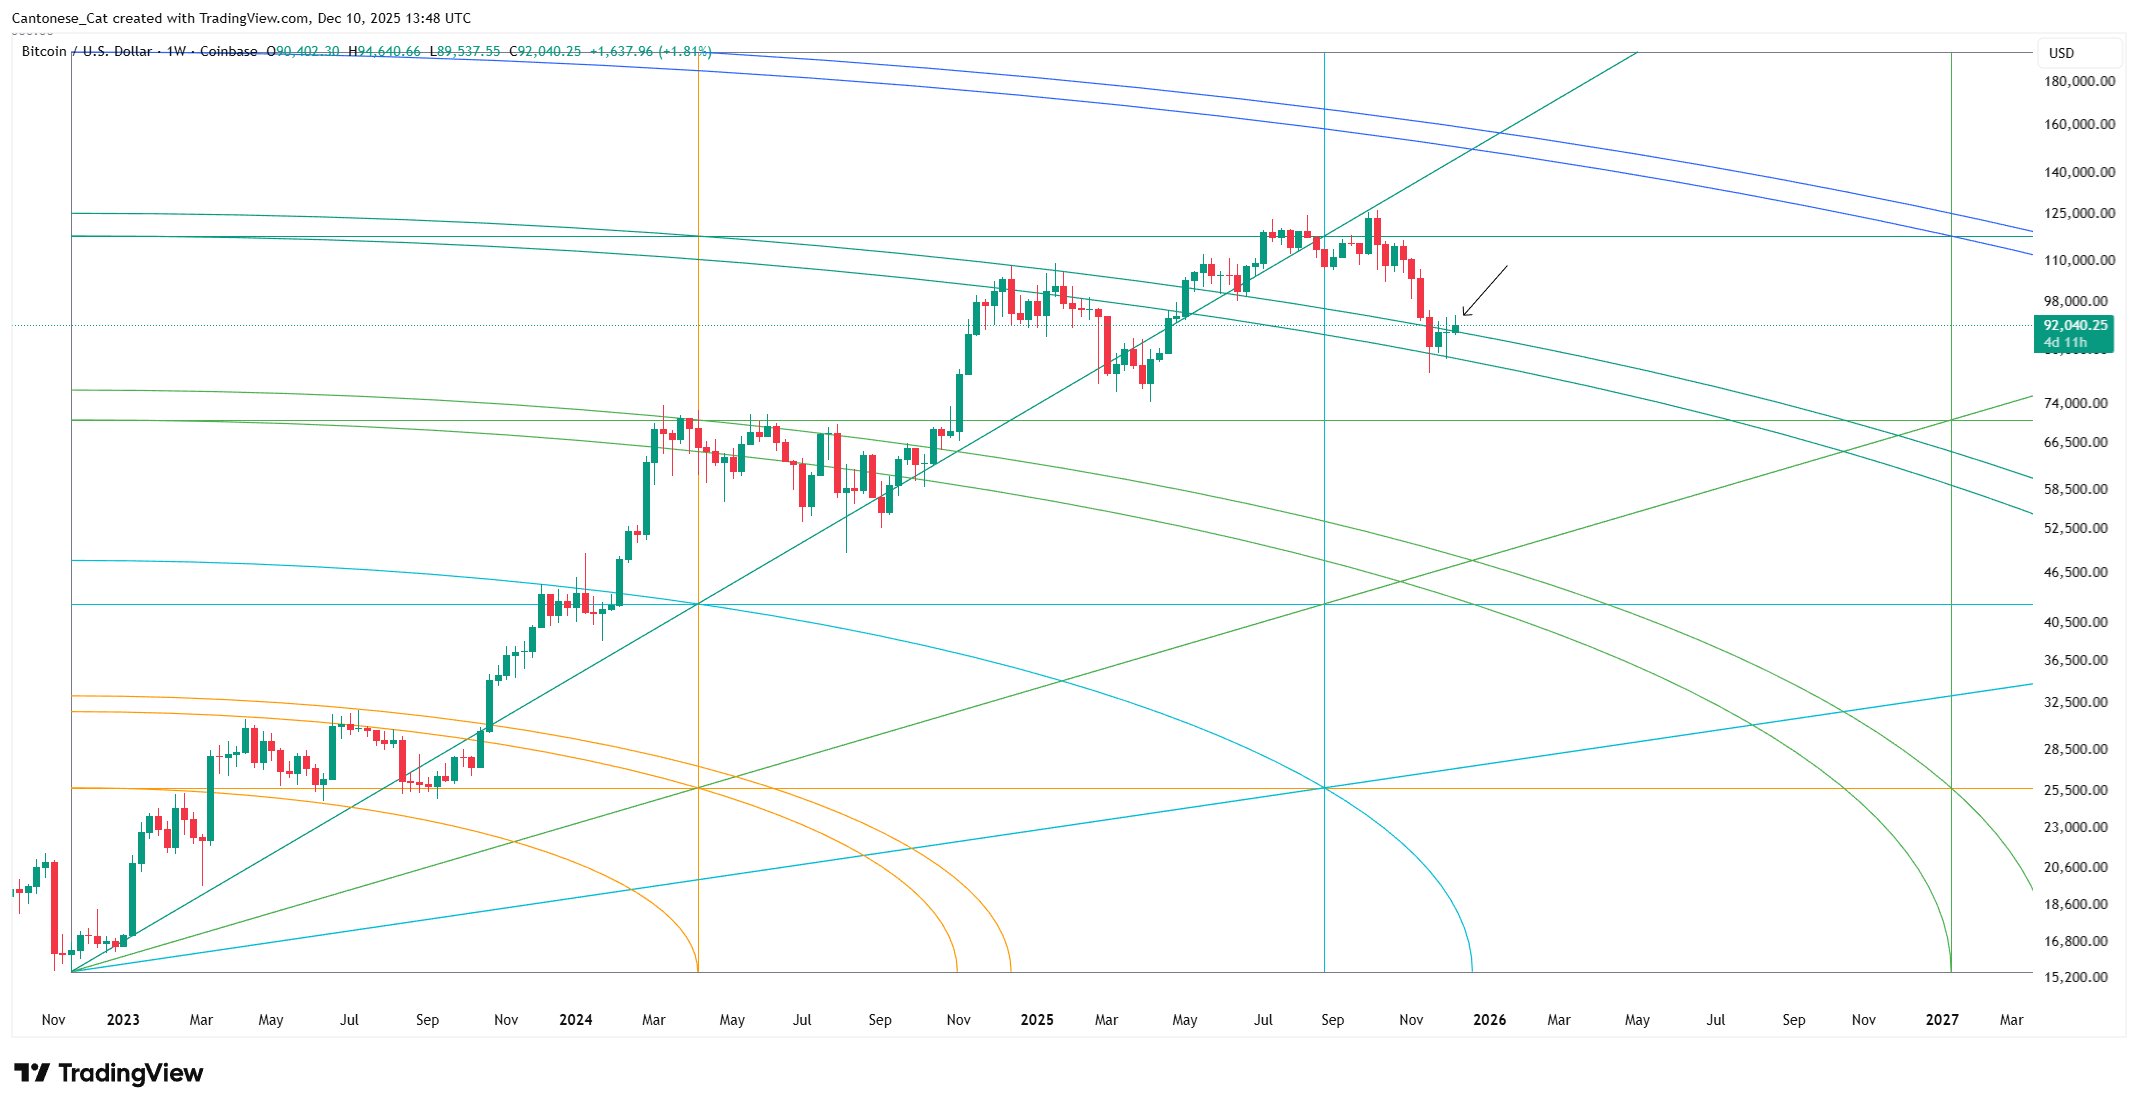
At the same time, the candle tests the Gann curve from below. If Bitcoin closes the week above this arc, the chart would signal a breakout attempt.
That move would show buyers stepping in at a key geometric level, and it would shift attention to the next band near 100,000 dollars.
Until a confirmed close appears, the arc only acts as an initial reaction point rather than proof of a new trend.
For now, price action stays muted. The weekly candle has a small body, and momentum does not show clear direction.
Because of that, the chart leaves both paths open. A clean drop under the arc would keep the bear-flag continuation alive, pointing to another lower low.
A weekly close above the curve would signal that buyers reclaimed control at a major Gann level.
The decision depends entirely on how this candle finishes, since the chart has not committed to either scenario yet.
Disclosure:This article does not contain investment advice or recommendations. Every investment and trading move involves risk, and readers should conduct their own research when making a decision.
Kriptoworld.com accepts no liability for any errors in the articles or for any financial loss resulting from incorrect information.

Tatevik Avetisyan is an editor at Kriptoworld who covers emerging crypto trends, blockchain innovation, and altcoin developments. She is passionate about breaking down complex stories for a global audience and making digital finance more accessible.
📅 Published: December 10, 2025 • 🕓 Last updated: December 10, 2025
