


Dec. 18, 2025 — Solana’s daily chart against the U.S. dollar shows a clear bearish flag pattern as price continues to weaken under key resistance levels.
The TradingView chart, timestamped Dec. 18, 2025, shows SOL trading near $122 after a steady decline from the November highs.
Stay ahead in the crypto world – follow us on X for the latest updates, insights, and trends!🚀
The pattern has already entered its testing phase, with price pressing against the lower boundary of the flag.
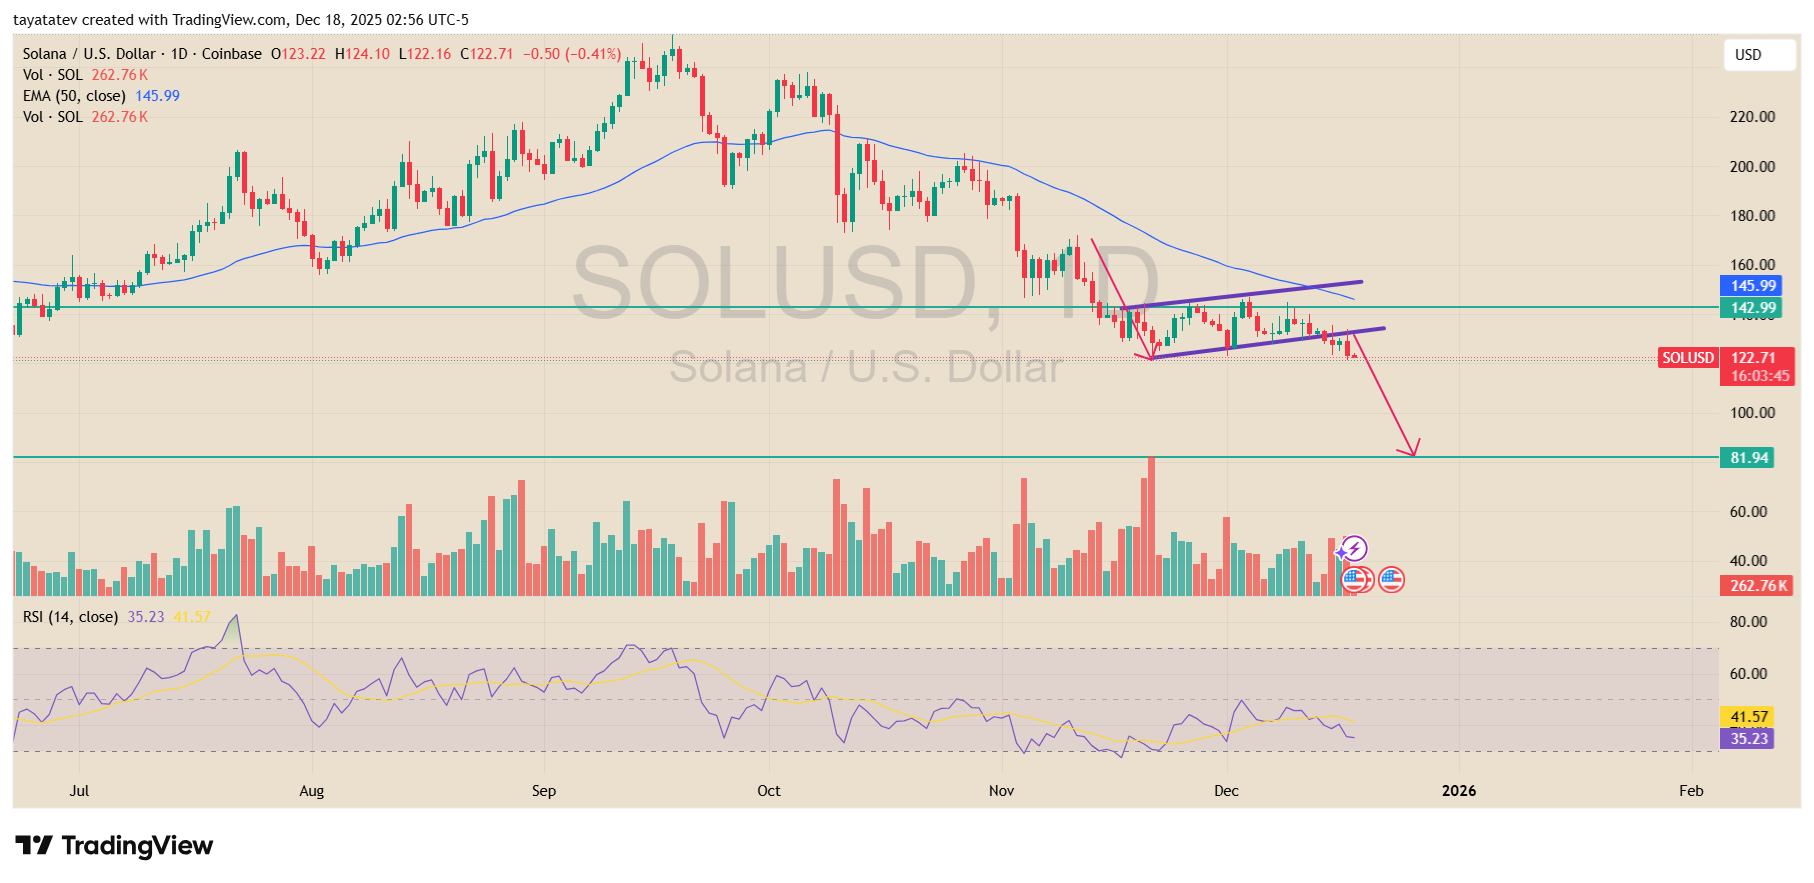
The bearish flag formed after a sharp selloff from the $180–$200 area, followed by a brief and narrow consolidation.
During this phase, price moved slightly higher inside a tight upward-sloping channel. However, the structure developed below the 50-day exponential moving average, which now sits near $146. That level continues to act as dynamic resistance, limiting any rebound attempts.
At the same time, horizontal support near $143 has flipped into resistance. Multiple daily candles failed to close back above that zone, confirming that sellers remain in control.
As price compresses near the lower edge of the flag, downside pressure has increased rather than eased. This behavior aligns with a textbook bearish flag, where consolidation pauses the trend before continuation.
Momentum indicators support the bearish setup. The 14-day RSI reads near 35, remaining below the neutral 50 level.
While the indicator avoids deep oversold territory, it shows weak recovery attempts and lower highs. This signals that buying strength remains limited during the consolidation phase.
Volume trends also add context. Trading activity contracted during the flag’s formation compared with the earlier selloff.
That pattern suggests the pause reflects hesitation, not accumulation. Historically, bearish flags resolve lower once volume expands again on the breakdown.
Based on the height of the prior move and the current structure, the pattern implies another leg down of roughly 33% from the current price.
From the $122 area, that projection points toward the $82–$85 range, which aligns closely with a prior demand zone marked near $82 on the chart.
That level served as support earlier in the year and may become the next area where price attempts to stabilize if the breakdown follows through.
Overall, Solana remains in a short-term downtrend, defined by lower highs, resistance at the 50-day EMA, and a bearish continuation pattern already under pressure.
Until price reclaims key resistance levels with strength, the technical structure continues to favor further downside.
Solana Sits Near $120 Support as Weekly Chart Maps $70–$80 Retest Before Higher Targets
Dec. 18, 2025 — A weekly SOL/USDT chart on Binance shows Solana sliding into a major support band as price trades near $120.
The TradingView snapshot, timestamped Dec. 18, 2025, shows SOL opening near $129.39, printing a high around $135.43 and a low near $121.36, before closing around $123.67 for a weekly drop of about 4.4%.
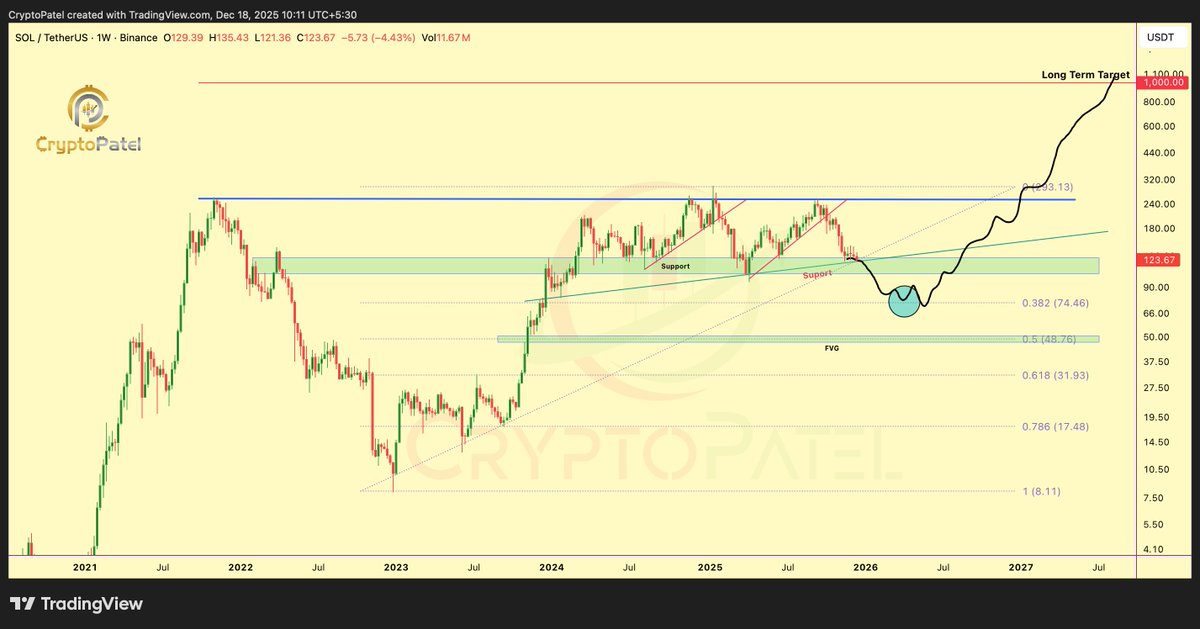
The chart frames the $120 area as a key decision zone because it lines up with a wide green support region that has held multiple pullbacks in 2024 and 2025.
However, the same chart also marks a lower support path toward the $70–$80 region, where a labeled Fibonacci level sits near $74.46.
As a result, the setup presents two nearby outcomes on the technical map: a bounce from the current support band or a deeper retracement into the next support pocket.
At the same time, overhead resistance remains clear. The chart highlights a major ceiling near $253.13, where prior rallies topped and reversed.
That level sits well above current price, so the chart’s structure implies Solana would need to reclaim the mid range and break that resistance before any sustained move toward higher long term targets becomes technically supported by price action.
Disclosure:This article does not contain investment advice or recommendations. Every investment and trading move involves risk, and readers should conduct their own research when making a decision.
Kriptoworld.com accepts no liability for any errors in the articles or for any financial loss resulting from incorrect information.

Tatevik Avetisyan is an editor at Kriptoworld who covers emerging crypto trends, blockchain innovation, and altcoin developments. She is passionate about breaking down complex stories for a global audience and making digital finance more accessible.
📅 Published: December 18, 2025 • 🕓 Last updated: December 18, 2025
