

")
The 3-day XRP/USD chart maps a Wyckoff path. It marks a 2024 accumulation base, then a strong markup, and now a re-accumulation box. Price sits near the mid-area after a pullback.
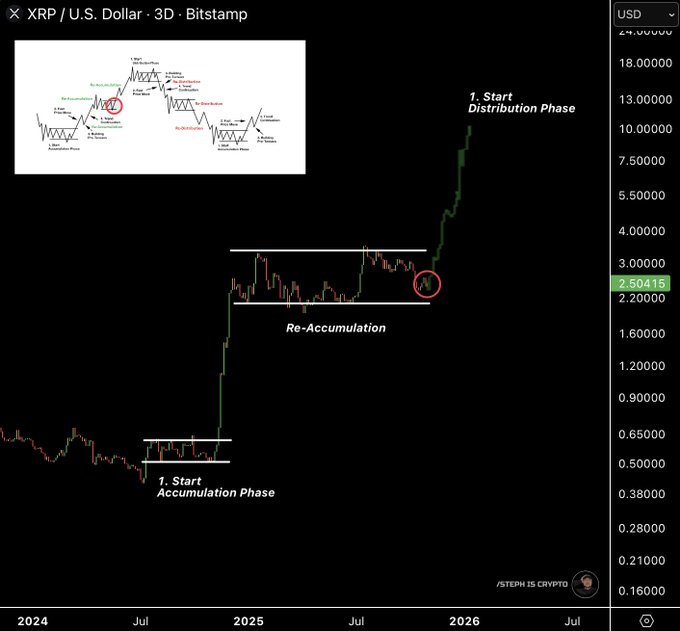
The graphic highlights a potential “spring/test” inside the box. The circled area shows buyers absorbing dips without losing the range floor.
Momentum cooled, yet structure remains intact. The range floor sits near $2.20. Each revisit drew bids and kept higher lows close by. As long as price holds above that band, the re-accumulation thesis stands.
The ceiling clusters around $3.10–$3.20. That zone capped every push during 2025. A clean break and 3-day close above it would signal demand in control.
In Wyckoff terms, the first phase shows accumulation, then markup. The current box reflects a pause to rebuild fuel. Re-accumulation often precedes another markup if supply keeps drying up.
However, distributions can appear after failed tests. If rallies keep stalling below resistance, supply may be active near the top of the box.
A decisive close above $3.20 would flip the box into support. Follow-through with rising highs and volume would fit a markup leg. In that case, prior targets on the chart point to $4.00 first and then the mid-$5 area.
Additionally, quick recoveries after shallow dips would show strong hands in charge. That behavior often accompanies successful spring tests.
A 3-day close below $2.20 would break the box. That move would negate the spring idea and signal supply dominance.
The next demand bands sit near $1.90 and $1.60 on the chart’s ladder. Furthermore, repeated rejections at $3.10–$3.20 with lower highs would turn the box heavy. That pattern would raise the odds of a full range retest.
XRP still trades inside a 3-day re-accumulation range. Holding above $2.20 keeps the bullish structure alive. Yet only a confirmed break over $3.20 would start the next advance; a loss of the floor would delay the move and invite deeper tests.
XRP prints falling wedge on Nov 3, 2025; a confirmed breakout points to ~4.17 (+73%)
XRP’s daily chart from Nov 3, 2025 (Bitstamp) shows a falling wedge that began after the July spike.
Price trades near $2.41, below the 50-day EMA at $2.65, and above key support around $2.02.
Volume cooled during the drift lower, while RSI sits near 41, leaving room for momentum to recover.

A falling wedge is a bullish reversal pattern. Trendlines slope down as price makes lower highs and lower lows, yet the range narrows.
Sellers lose control as bounces grow stronger; then a break above the upper trendline often triggers a fast markup toward prior supply.
Here, the upper wedge line caps rallies near $2.55–$2.70. A daily close above that line, followed by strength over the 50-day EMA, would confirm the break.
If confirmed, the measured move aligns with the charted target zone around $4.18. From the current $2.41, that implies roughly a 73% advance to ~$4.17–$4.18.
Interim hurdles sit at $2.85, $3.10, and $3.50. Holding above $2.02 keeps the setup intact; a daily close below it would invalidate the bullish wedge and expose $1.85–$1.70.
In sum, bulls need a clean breakout and follow-through above the wedge and the 50-day EMA. If they deliver, the pattern projects a run toward the $4.17–$4.18 resistance band.
Disclosure:This article does not contain investment advice or recommendations. Every investment and trading move involves risk, and readers should conduct their own research when making a decision.
Kriptoworld.com accepts no liability for any errors in the articles or for any financial loss resulting from incorrect information.

Tatevik Avetisyan is an editor at Kriptoworld who covers emerging crypto trends, blockchain innovation, and altcoin developments. She is passionate about breaking down complex stories for a global audience and making digital finance more accessible.
📅 Published: November 3, 2025 • 🕓 Last updated: November 3, 2025
