


First, a whale shorting $60 million in ZEC was wiped out in a single liquidation wave.
Now, a tightening bullish pattern on the chart is mapping a potential path toward the $1,000 region.
Whale Shorting $60M in ZEC Fully Liquidated, Arkham Says
A leveraged trader who shorted about $60 million worth of Zcash (ZEC) has been fully liquidated, according to blockchain analytics firm Arkham Intelligence.
The loss totaled roughly $5.5 million as the whale tried to bet against ZEC’s latest rally.
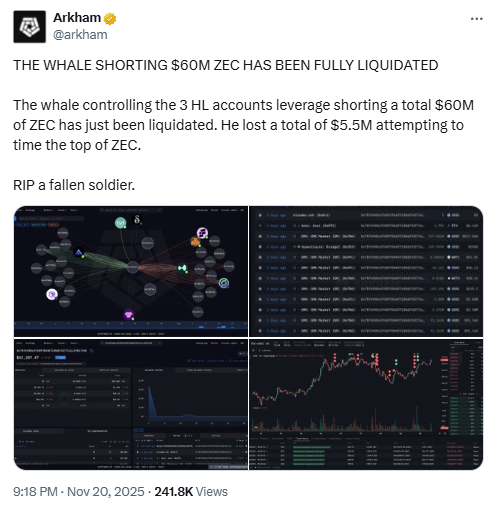
In its post on X, Arkham said the trader controlled three HL accounts that opened large leveraged short positions on ZEC.
As the price moved higher instead of lower, the positions hit their margin limits and triggered forced liquidations across the accounts.
Arkham added that all three accounts were tied to the same market participant, linking the activity through on-chain data and exchange records.
The wipeout underscores how aggressive leverage can quickly erase capital when volatile tokens like ZEC move against heavily margined trades.
ZEC Ascending Triangle Points to Possible Move Toward $1,000
The chart from CryptoBoss shows Zcash trading inside an ascending triangle, with price pushing repeatedly against a horizontal resistance band near the 760 zone.
At the same time, higher lows form along a rising trendline, which keeps compressing price into the apex of the pattern.
This structure often signals that buyers are absorbing supply each time ZEC pulls back, while sellers defend the same ceiling.
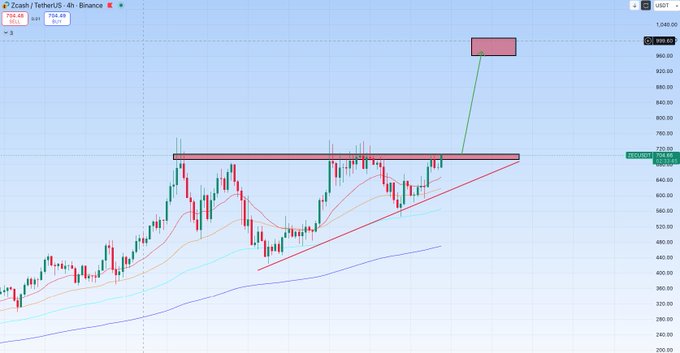
In addition, short-term moving averages on the four-hour Binance chart curve upward beneath price, which indicates that recent candles still lean in favor of the uptrend.
Each dip into these averages has so far attracted demand, helping ZEC hold above prior swing lows.
As long as the rising trendline stays intact, the setup continues to pressure the resistance area from below.
From a pattern-measurement view, the projected target box around $1,000 comes from adding the triangle’s height to the breakout level.
If ZEC closes decisively above the resistance band with strong volume, the move would technically validate the ascending triangle and open room toward that mapped zone.
However, if price fails to break out and instead falls back under the rising support line, the bullish structure would weaken and the pattern could invalidate.
Disclosure:This article does not contain investment advice or recommendations. Every investment and trading move involves risk, and readers should conduct their own research when making a decision.
Kriptoworld.com accepts no liability for any errors in the articles or for any financial loss resulting from incorrect information.

Tatevik Avetisyan is an editor at Kriptoworld who covers emerging crypto trends, blockchain innovation, and altcoin developments. She is passionate about breaking down complex stories for a global audience and making digital finance more accessible.
📅 Published: November 21, 2025 • 🕓 Last updated: November 21, 2025
