


Dogecoin (DOGE) traded near $0.12798 on the daily DOGEUSD chart (Coinbase) on Dec. 19, 2025, after weeks of lower highs inside a downward channel.
Meanwhile, price stayed below the 50 day EMA near $0.15440, which continued to cap rebounds and reinforce the broader downtrend shown by the descending trendlines.

A bearish flag forms when price drops hard, then drifts upward or sideways in a tight channel before sellers try to resume the prior decline.
On this chart, DOGE printed a sharp selloff in October, then consolidated in a narrow, rising slant between the purple trendlines, which matches the classic bearish flag structure.
DOGE has not confirmed the breakdown yet, because confirmation usually requires a daily close below the flag’s lower boundary, followed by continued selling that holds below the broken support.
Still, the chart shows price pressing the lower edge of the flag while the RSI (14) sits near 38.39, which signals weak momentum and keeps buyers on the defensive.
If DOGE confirms with a clean breakdown and follow through, the common measured move targets the prior “flagpole” distance.
Based on the levels marked on the chart, that projection points toward the $0.02954 area, which implies roughly a 77% drop from $0.12798.
However, the pattern can fail if DOGE reclaims the flag and closes back above nearby resistance levels around $0.15388 to $0.15811, especially if it also regains the 50 day EMA.
DOGE stays in corrective phase as chart watchlists focus on $0.096, $0.080, and $0.054
Dogecoin’s long term chart still shows a corrective phase that started in November 2024, while the short term trend points lower, according to a DOGEUSD daily chart on Binance shared by market analyst More Crypto Online.
Price traded near $0.1214 at the time of the chart, as the downtrend from the 2025 peak continued to press recent support zones.
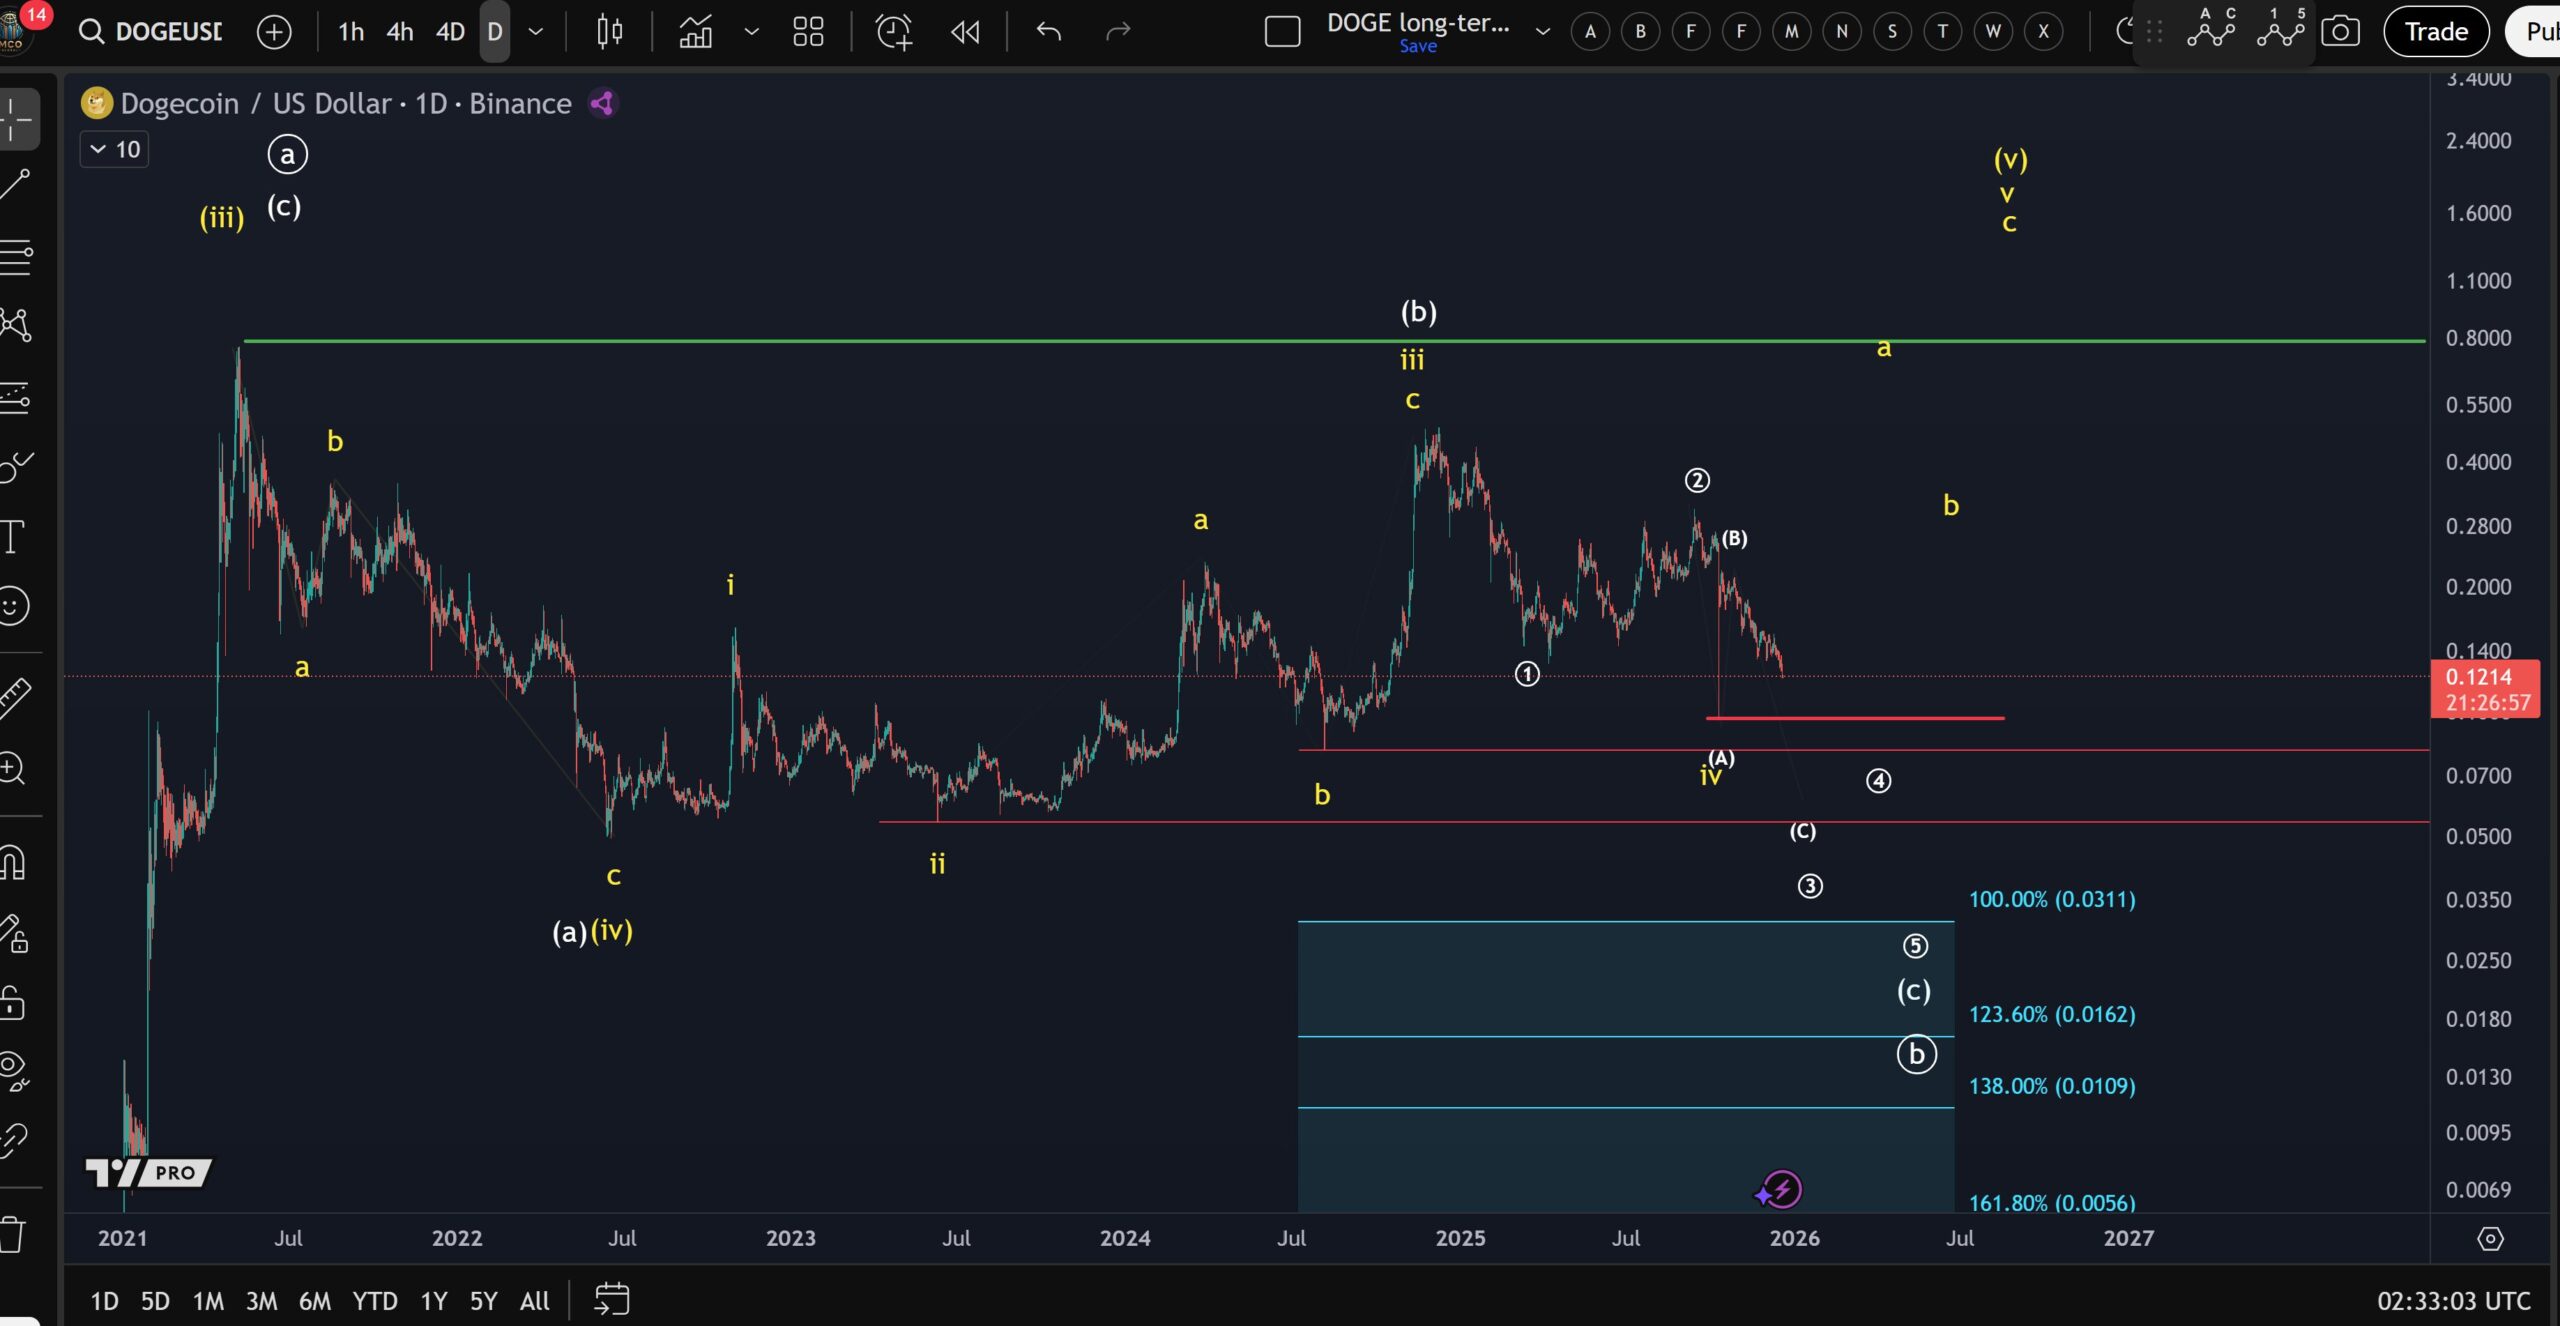
A sharp drop on Oct. 10 complicated the broader wave structure, the analyst said, because that move disrupted prior swing points and made the pattern harder to label.
Even so, the update kept earlier scenarios in play, including one path that still allows another high, although selling pressure continued to dominate near term.
The analyst highlighted $0.096 as a key line, describing it as the Oct. 10 low and a level that could act as a trigger for the next leg lower if price fails to stabilize before breaking beneath it.
After that, the next areas on the downside watchlist sit near $0.080 and $0.054, while the analyst said the chart has not yet shown clear evidence of a local bottom.
Disclosure:This article does not contain investment advice or recommendations. Every investment and trading move involves risk, and readers should conduct their own research when making a decision.
Kriptoworld.com accepts no liability for any errors in the articles or for any financial loss resulting from incorrect information.

Tatevik Avetisyan is an editor at Kriptoworld who covers emerging crypto trends, blockchain innovation, and altcoin developments. She is passionate about breaking down complex stories for a global audience and making digital finance more accessible.
📅 Published: December 19, 2025 • 🕓 Last updated: December 19, 2025
